- Survey analysis tools aren't interchangeable. The right choice depends on your data and research workflow
- Some platforms offer broad research suites, while others specialize in doing one part of the workflow particularly well
- Compare tools based on your actual use case, not the length of their feature lists
- For open-ended responses, look closely at coding accuracy, coverage, human control, and the amount of manual work required
Survey analysis software is the fastest and easiest way to analyze survey responses for powerful insights.
Whether you're running customer satisfaction surveys, employee engagement polls, or market research studies, the right software helps you uncover trends, measure sentiment, and make data-driven decisions with confidence.
This guide breaks down what survey analysis software does, how it's changed in recent years, and the nine best survey analysis tools so you can find the perfect fit for your needs.
(Quick note before we get into it: we build one of the nine tools covered here, Blix, so keep that in mind as you read. We've tried to be straight about where each one, including ours, is or isn't the right fit.)
Let's dive in.
How We Researched This List
We built each profile from a mix of hands-on use, our team's own experience, and what we hear every day from customers, prospects, and colleagues across the research industry. Where a tool is free or offers a free trial, like Google Data Studio, Tableau, ChatGPT, Claude, and Base44, we used it ourselves. Others, like SPSS and SurveyMonkey, our team has worked with directly over the years. And because many of our customers run large platforms like Qualtrics alongside Blix, we hear firsthand what works for them and what doesn't.
To round that out, we drew on each platform's own documentation and aggregated, verified user reviews on G2. Where a limitation comes from reviews rather than our own experience, we've said so.
We're Blix, and we're one of the ten tools on this list. Where we make a claim about our own product, we've tried to hold it to the same standard.
What Is Survey Analysis Software?
Survey analysis software helps researchers turn raw survey responses into findings they can actually use.
But not every platform analyzes survey data in the same way. A tool designed for cross-tabs and statistical testing solves a very different problem from one designed to code thousands of open-ended responses. Some platforms cover the entire survey workflow, while others specialize in a particular stage of the analysis.
That's why the first question shouldn't be "Which survey analysis platform has the most features?" It should be "What type of survey data am I trying to analyze, and what do I need to do with it?"
Common Users:
- Market researchers analyzing consumer trends
- Customer experience (CX) teams improving service
- Product managers validating feature ideas
- People teams analyzing employee engagement surveys
Why Survey Analysis Software Matters
Spreadsheets work perfectly well for some survey analysis tasks. If you’re analyzing a relatively small dataset, calculating frequencies, or creating basic cross-tabs, you may not need dedicated survey analysis software at all.
The problem starts when the analysis becomes difficult to manage manually.
Thousands of responses, multiple segments, recurring studies, or large volumes of open-ended feedback can quickly turn a spreadsheet into a bottleneck. At that point, the question isn’t whether Excel can technically handle the data. It’s how much researcher time you’re spending cleaning, coding, checking, and reorganizing it.
This is particularly noticeable with open-ended responses. Coding hundreds or thousands of comments manually takes time, and two researchers won’t necessarily interpret every response in exactly the same way. Modern AI-driven tools can automate much of that work while still allowing researchers to review and adjust the results.
Gal Orian, co-founder of Blix, ran into exactly this problem before starting the company. In a previous role, his team ran a monthly NPS survey with around 10,000 respondents. The NPS score itself was easy to share across the business. Alongside it sat a spreadsheet containing thousands of free-text comments explaining what customers actually wanted and needed.
As Gal puts it: “It was gold. But obviously you can’t read 10,000 comments a month.”
And that’s really the point of survey analysis software. The goal isn’t to add another tool to the research stack. It’s to make survey data that would otherwise be too slow, repetitive, or difficult to analyze actually usable.
The right platform depends on where that bottleneck sits. Some teams need stronger statistical analysis and visualization. Others need help analyzing open-ended responses at scale. Some want an end-to-end survey platform, while others already have their collection process and simply need a better way to analyze what comes back.
Real-world teams are already seeing the benefits:
- A SaaS company might use automated sentiment analysis to catch early warning signs of churn from NPS comments.
- A healthcare provider could analyze patient satisfaction surveys across demographics to uncover gaps in care.
Evidence from real-world use: Generosity X reported reaching insights 5x faster while reducing manual work by 82% using Blix.
What Types of Survey Analysis Tools Are There?
Before comparing platforms, it's useful to separate survey analysis software into a few broad categories.
Quantitative analysis tools
Quantitative analysis tools focus on structured data. They're typically strongest at cross-tabs, segmentation, statistical testing, significance testing, and tracking changes over time.
Qualitative and text analysis tools
Qualitative and text analysis tools focus on what respondents actually say. These tools help users code, group, and understand free-form answers to open-ended questions through coding, theme discovery, and sentiment analysis. Methods range from manual and rule-based coding to machine learning and natural language processing (NLP), and lately, AI and large language models (LLMs).
Visualization and reporting tools
Visualization and reporting tools don't analyze the data themselves. They turn results into dashboards and reports that teams and clients can explore.
End-to-end research platforms
End-to-end research platforms try to cover the whole process, from survey creation and distribution to quantitative and open-ended analysis, dashboards, and reporting.
General-purpose AI tools
General-purpose AI tools aren't built for survey research, but they're increasingly part of it. They can help with tasks like summarizing responses, interpreting results, or building a quick dashboard from a plain-language request.
None of these categories is inherently better than another. They solve different problems. A market researcher coding 20,000 open-ended responses has very different requirements from a CX team building an executive dashboard or an academic researcher running regression analysis.
How Did We Evaluate the Survey Analysis Platforms?
There isn't one feature checklist that makes a survey analysis platform "the best." We looked at the tools based on parts of the research workflow they're actually designed to handle.
For each platform, we considered:
- Types of analysis: Does it handle quantitative analysis, qualitative analysis, or both?
- Researcher control: Can researchers review, edit, merge, split, or otherwise adjust the analysis rather than treating the software's output as final?
- Manual work required: How much cleaning, checking, restructuring, or correcting is still required after the initial analysis?
- Ease of use: How much setup, training, or technical knowledge is required before a researcher can get useful results?
- Reporting and visualization: How easily can researchers explore the findings and turn them into something useful for clients or internal teams?
- Integrations and exports: How well does the platform fit into an existing research workflow?
- Scale: Can it handle thousands of responses, multiple languages, recurring studies, and larger datasets without creating a new manual bottleneck?
- Privacy and security: How does the platform handle sensitive respondent and customer data?
- Open-ended analysis: How does it handle coding, themes, sentiment, context, and unstructured text?
- Accuracy and coverage: Does the analysis reliably capture what respondents are actually saying, including nuance and context, rather than simply identifying keywords?
These criteria reflect a fairly simple principle: survey analysis software should reduce repetitive work without taking control away from the researcher. As Blix co-founder Idan Haviv puts it, the goal is to let researchers spend more of their time on "the design, thinking, decision-making, taste" and less on the repetitive technical work around it.
What Key Features Should You Look For?
The right features for your survey analysis software will depend on the type of data you're working with, quantitative, qualitative, or both, and the kind of insights you're aiming to uncover.
For quantitative analysis, strong statistical and segmentation tools are critical. Look for:
- Data cleaning to remove duplicates and standardize inconsistent responses
- Segmentation and filtering to break down results by specific customer groups
- Cross-tabulation and statistical testing (e.g., chi-square, regression, significance testing) to validate patterns and draw conclusions
If you're working with open-ended responses or other unstructured qualitative feedback, prioritize tools designed for deep text analysis:
- AI-powered theme discovery to quickly uncover key topics and themes
- Flexible text coding options, including manual tagging support or fully automated AI coding
- Sentiment analysis to capture emotional tone, trends, and underlying context
- Multilingual support to analyze global feedback without losing cultural or linguistic nuance
If you want one platform to handle the whole survey process, from building the survey to reporting the results, look at end-to-end platforms. Look for:
- Survey creation and programming, including advanced logic, quotas, and randomization
- Distribution and data collection across channels like email, SMS, web, and in-app
- Access to respondent panels if you need to source participants
- Both quantitative and open-ended analysis in the same place
- Governance and permissions for large teams running many studies at once
Beyond core analysis features, the following capabilities can streamline your workflow and make sharing insights easier:
- Dashboards for real-time visualization and stakeholder reporting
- Collaboration tools that allow multiple team members to code or comment
- Export options like Excel, SPSS, and PowerPoint to move data into other systems easily
Choosing a tool with the right mix of features ensures your survey data turns into decisions faster and more reliably.
How Is AI Changing Survey Analysis?
Worth being clear about what this doesn't replace, though. AI can speed up the repetitive parts of survey analysis, like cleaning data, running cross-tabs, coding open-ends, and summarizing results, and it can flag patterns a person might miss across a large dataset. But judgment calls, deciding what's actually important, and spotting the thing nobody thought to ask about still need a researcher in the loop.
What Are the 10 Best Survey Analysis Software Tools?
Now that you know what to look for, here's how the ten break down by what they're actually best at.
Best for Enterprise-Level Survey Programs
Qualtrics XM
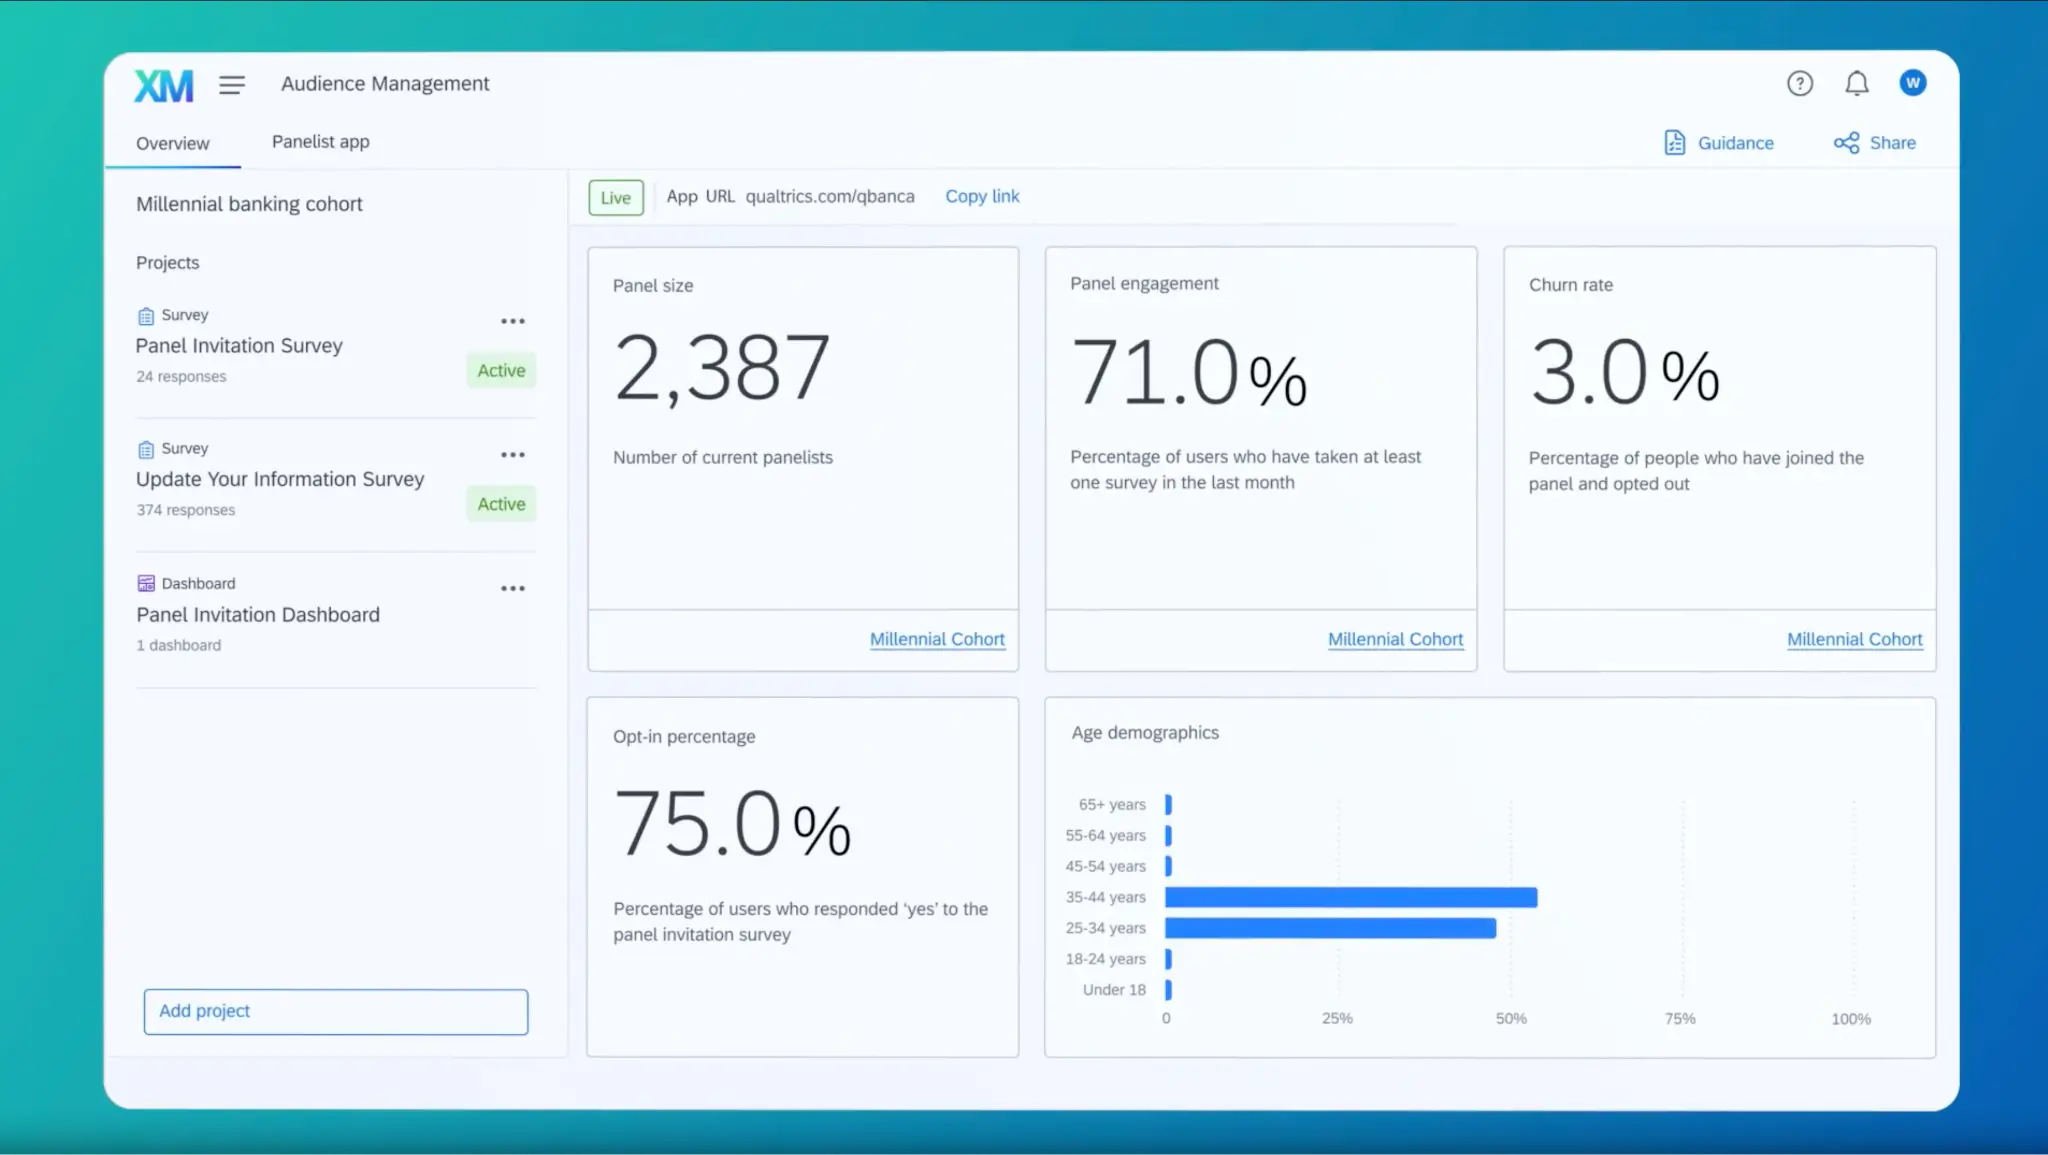
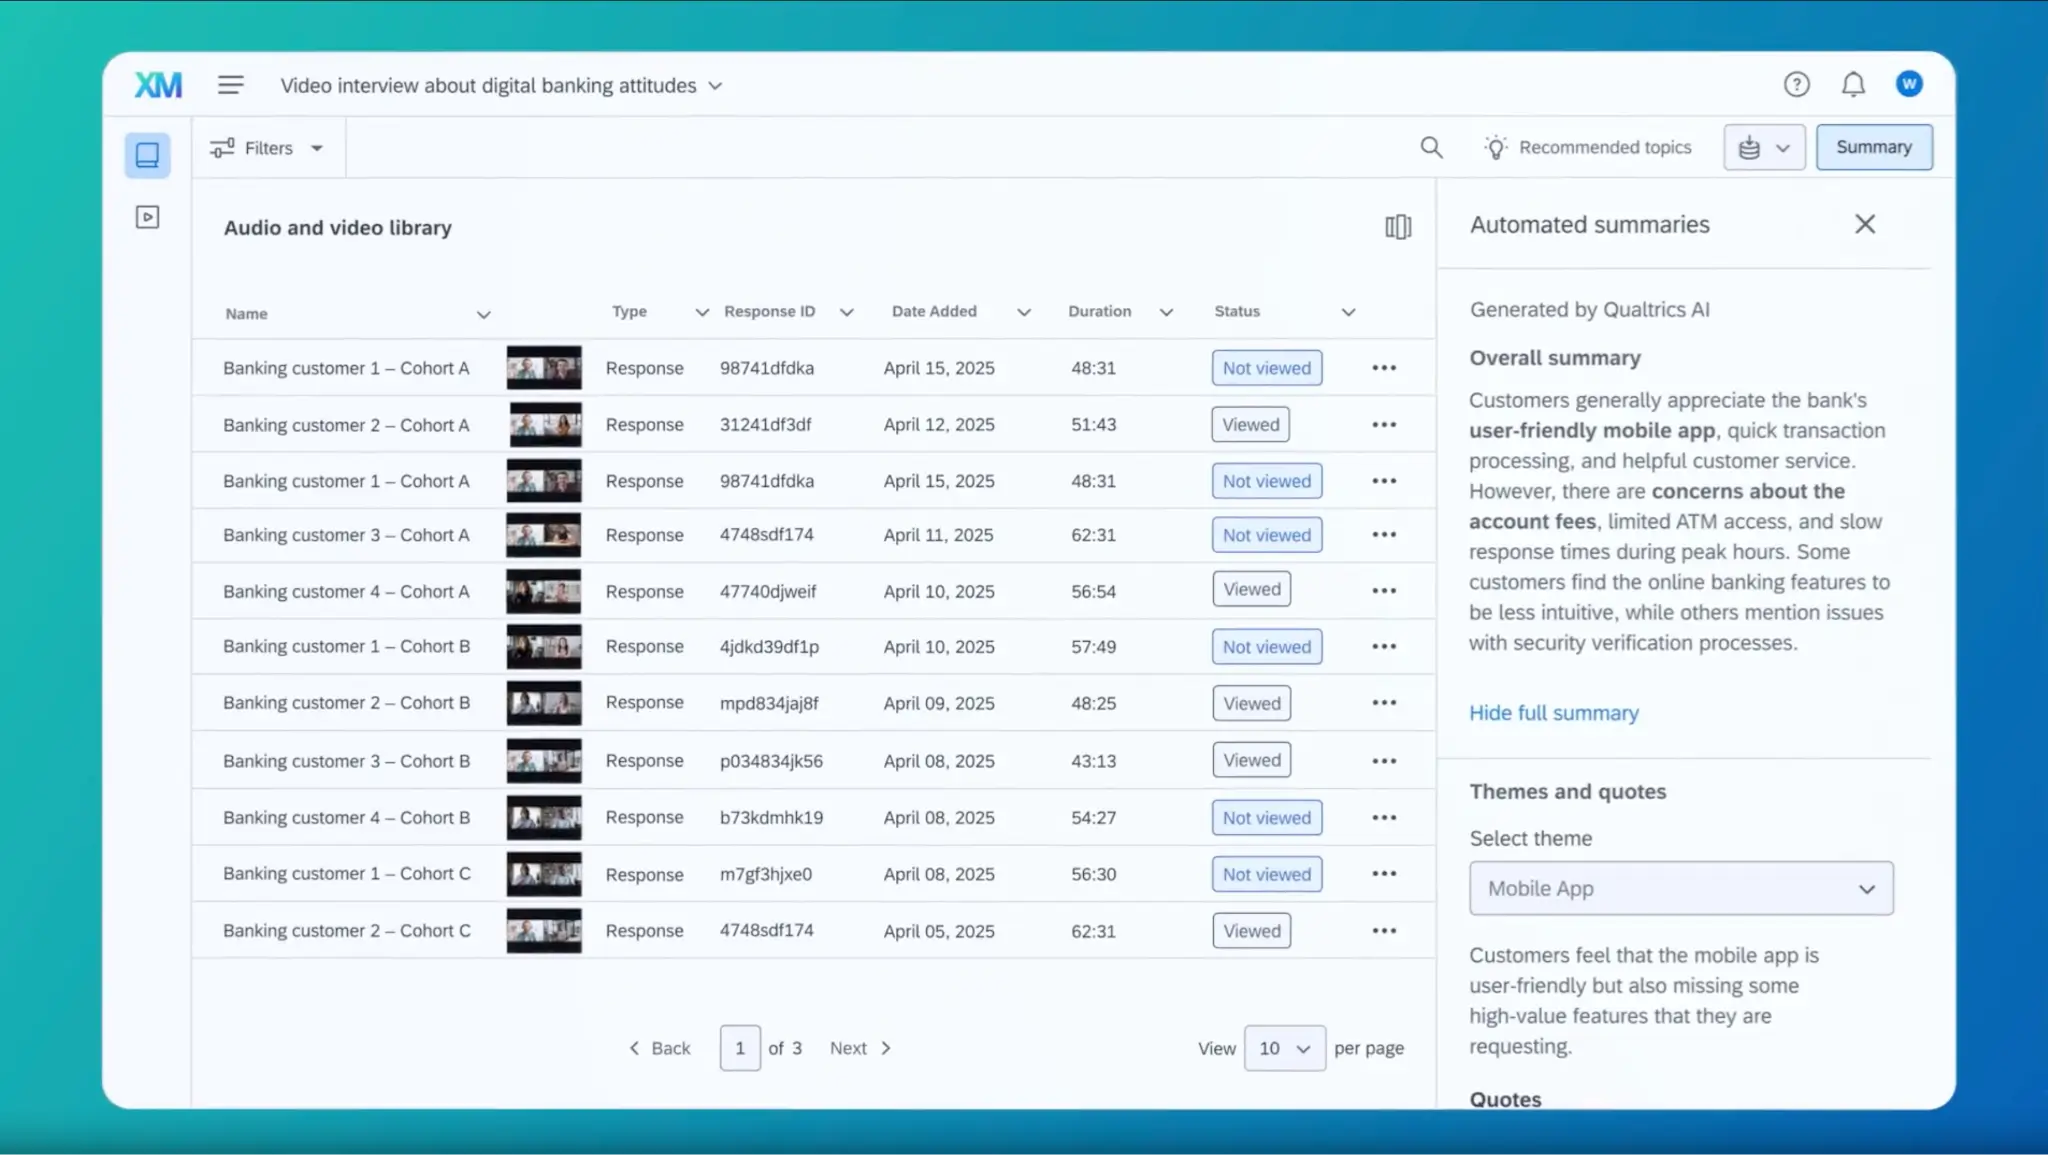
Qualtrics XM is one of the biggest names in survey research and the company that created the experience management category. It combines survey research with customer, employee, product, and brand experience data in one platform, and it's used by many of the world's largest companies. When Silver Lake took it private in 2023, the deal valued it at roughly $12.5 billion.
Key Features:
- AI-driven analytics
- Customer experience insights
- Real-time data analysis and reporting
- Enterprise-level security and governance
Strengths: Qualtrics is the most complete research platform on this list. It handles complex survey designs, including advanced logic, quotas, conjoint, and MaxDiff, and it pairs them with built-in statistical analysis, text analytics, and dashboards for sharing results across an organization. Enterprise-grade security and governance make it a safe choice for large companies with strict data requirements. If you need one platform that can run almost any type of study from start to finish, this is it.
Limitations: According to G2 reviews, Qualtrics is genuinely powerful but comes with real friction. A steep learning curve shows up constantly in reviews, and pricing climbs fast once you need advanced features. Many features also depend on your specific license, so what you see in a demo may not necessarily be included in your plan.
For text analysis specifically, Qualtrics relies on its Text iQ component. Its approach is largely keyword and rule-based, which can require significant manual setup, refinement, and ongoing effort to get useful coding and categorization results.
Best for: Large organizations and enterprise research teams that run many types of studies, such as CX, employee, brand, and product research, and want one platform for design, collection, analysis, and reporting. It's also a strong fit for research agencies running complex studies for enterprise clients who already use Qualtrics.
Best for Small Businesses & Startups
SurveyMonkey
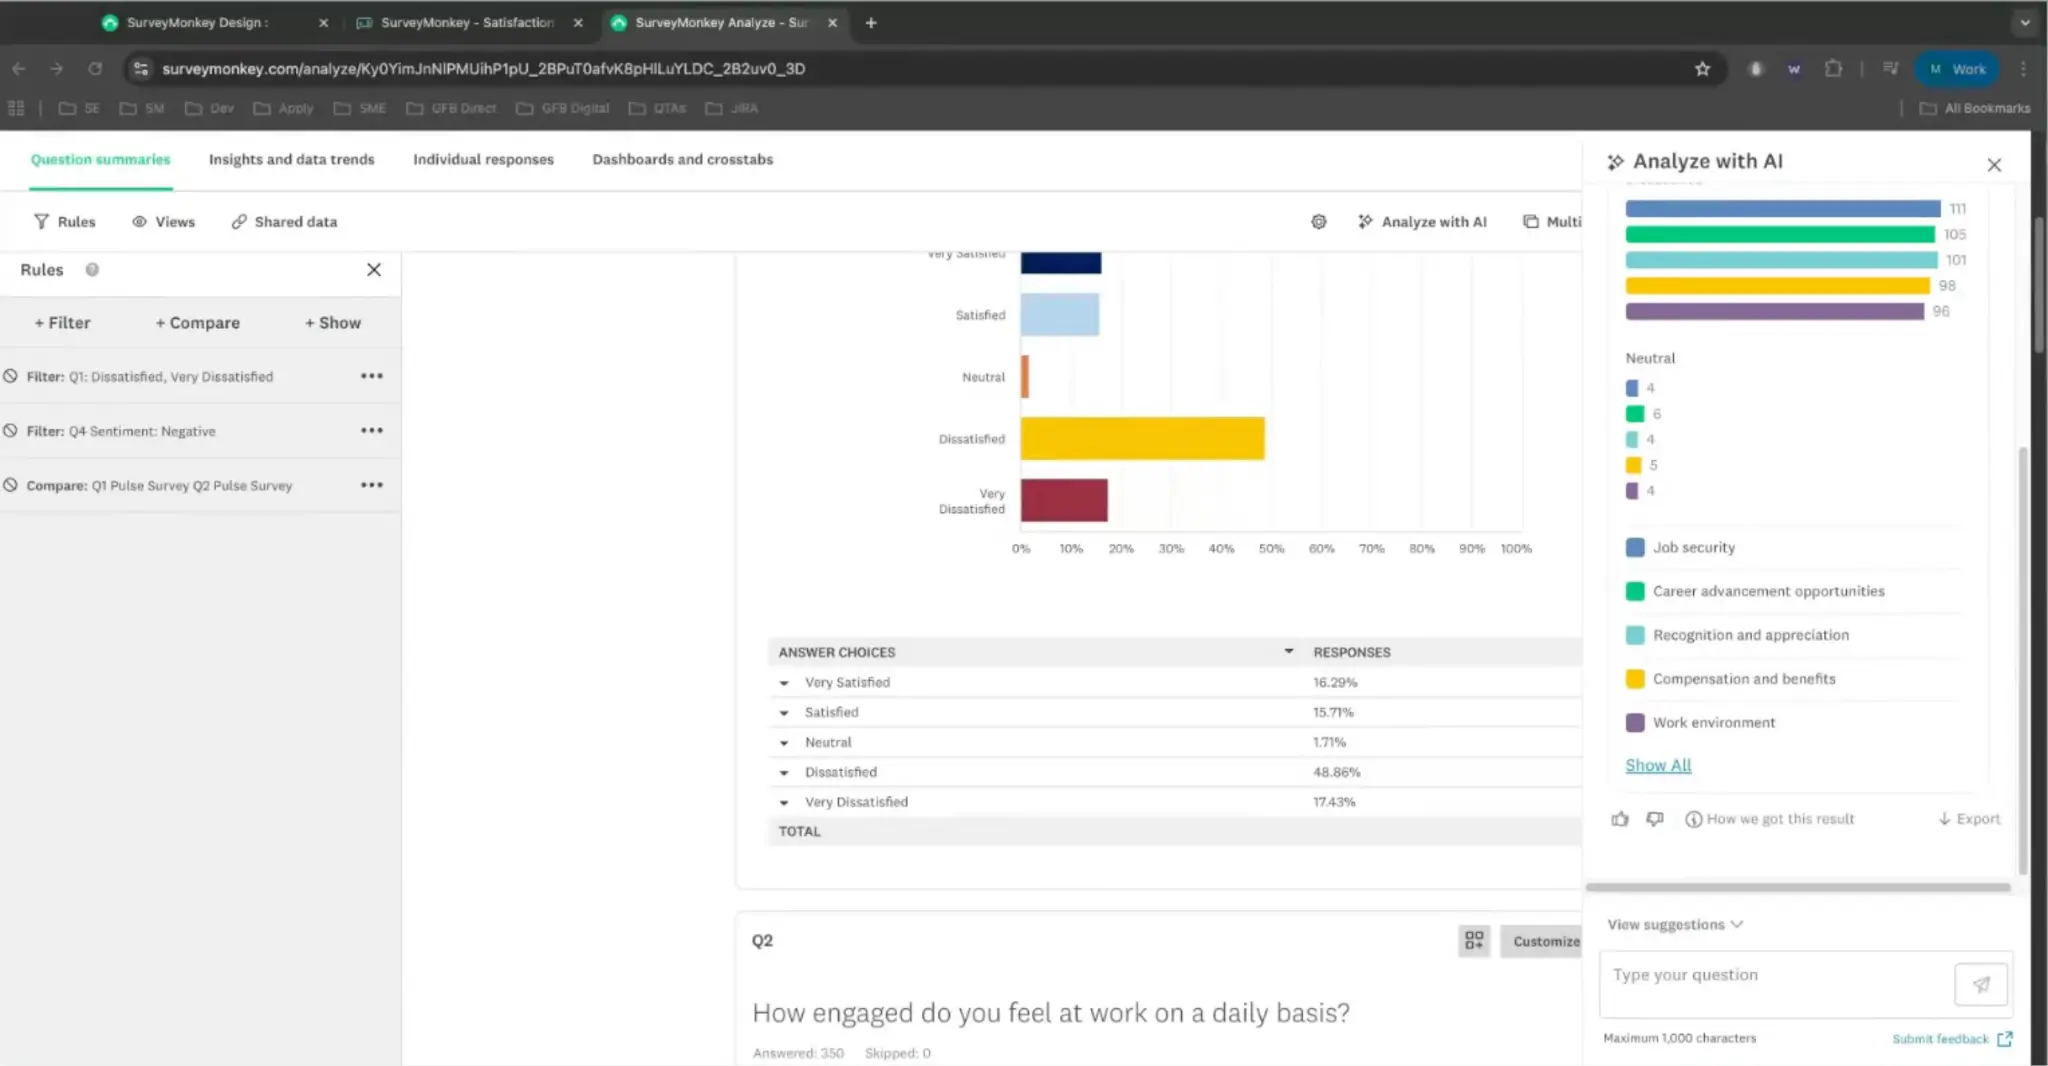
SurveyMonkey combines survey creation with built-in analysis tools, making it a straightforward option for teams that want to collect responses and analyze the results in the same platform.

Key Features:
- Automated insights
- Sentiment analysis
- Benchmarking capabilities
- Built-in survey creation and collection
- Claude connector to create, send, and analyze surveys directly in Claude
Strengths: SurveyMonkey is one of the easiest ways to get a survey out the door. The builder is simple enough that anyone on a team can put together a professional-looking survey in minutes, with a large template library and question bank to start from. Results show up as charts as soon as responses come in, so you can see what's happening without any setup. If you need respondents, you can buy them through its built-in audience panel. For a quick pulse survey, a customer feedback form, or an internal poll, it does what most teams need without any training. It also connects directly to Claude, so you can build a survey, send it, and ask questions about the results in plain language, all without exporting any data.
Limitations: SurveyMonkey is built for simple surveys, and that's where it shines. For more complex research it starts to fall short. Advanced logic, quotas, and complex study designs are limited compared to research-grade platforms, and the analysis is mostly charts, filters, and basic cross-tabs. Open-ended responses get light text analysis like word clouds rather than real coding, so research teams usually end up exporting the data to analyze it somewhere else.
Best for: Small businesses and teams looking for a straightforward way to create surveys, collect responses, and perform basic analysis.
Best for Visualization & Reporting
One thing worth knowing before you pick a dashboard tool: you may not need to learn one anymore. AI tools like Base44 and Claude (covered under AI-assisted analysis below) can build a dashboard from a plain-language request, with no interface to learn.
Google Data Studio
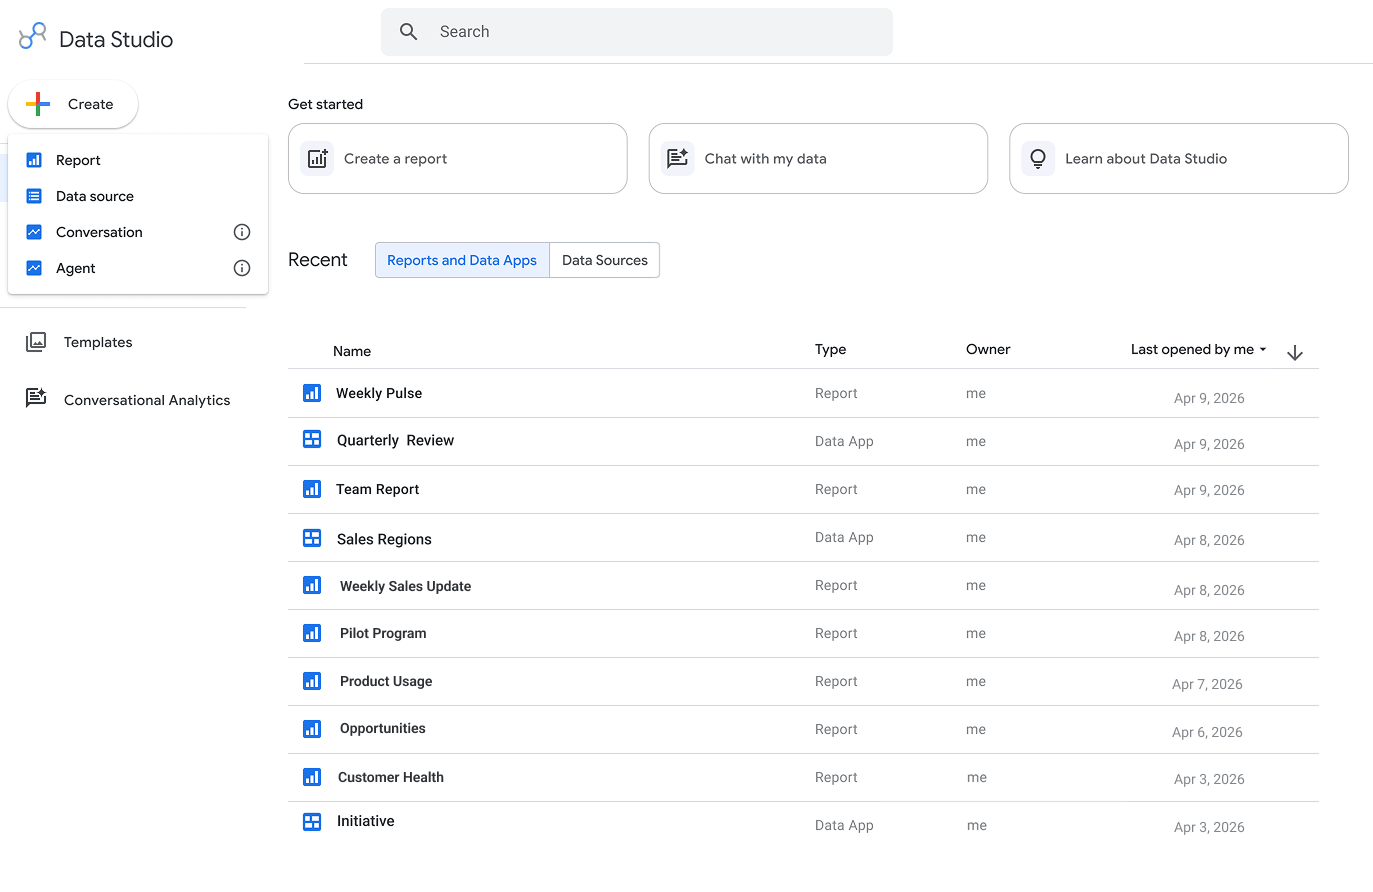
Google Data Studio (formerly Looker Studio) is a free data visualization and reporting tool that can be used to turn survey data into interactive dashboards. Rather than performing specialized survey analysis itself, it is primarily useful for visualizing, exploring, and presenting survey results from connected data sources.
Key Features:
- Connects natively across the Google ecosystem, including Google Sheets, Forms, BigQuery, and Search Console. In our experience, it can even surface more Search Console data than Search Console's own interface shows
- Interactive reports and dashboards
- Customizable charts and visualizations
- Shareable reporting
- Built on Google's infrastructure, which makes it easier for many teams to feel comfortable connecting sensitive data
Strengths: Data Studio is free, and if your data already lives in Google, it connects with almost no setup. Reports are shared the same way you share a Google Doc, so getting results in front of a team takes seconds. For ongoing tracking, dashboards update automatically as new data comes in, so there's no need to rebuild reports every wave.
Limitations: Looker Studio visualizes data, but it doesn't analyze it. It won't code, clean, or statistically test your responses, and open-ended answers show up as raw text, so you need another tool to do the actual analysis first. Building reports also means learning its interface click by click. With LLM-based tools you can just describe the change you want in plain language, and next to that, Looker Studio's manual way of working already feels dated. The dashboards themselves are functional but plain. For internal tracking that's fine, but for client-facing work, most agencies will want something that looks more polished.
Best for: Individuals and teams that need a free way to visualize and report on survey data, particularly when working within the Google ecosystem.
Tableau
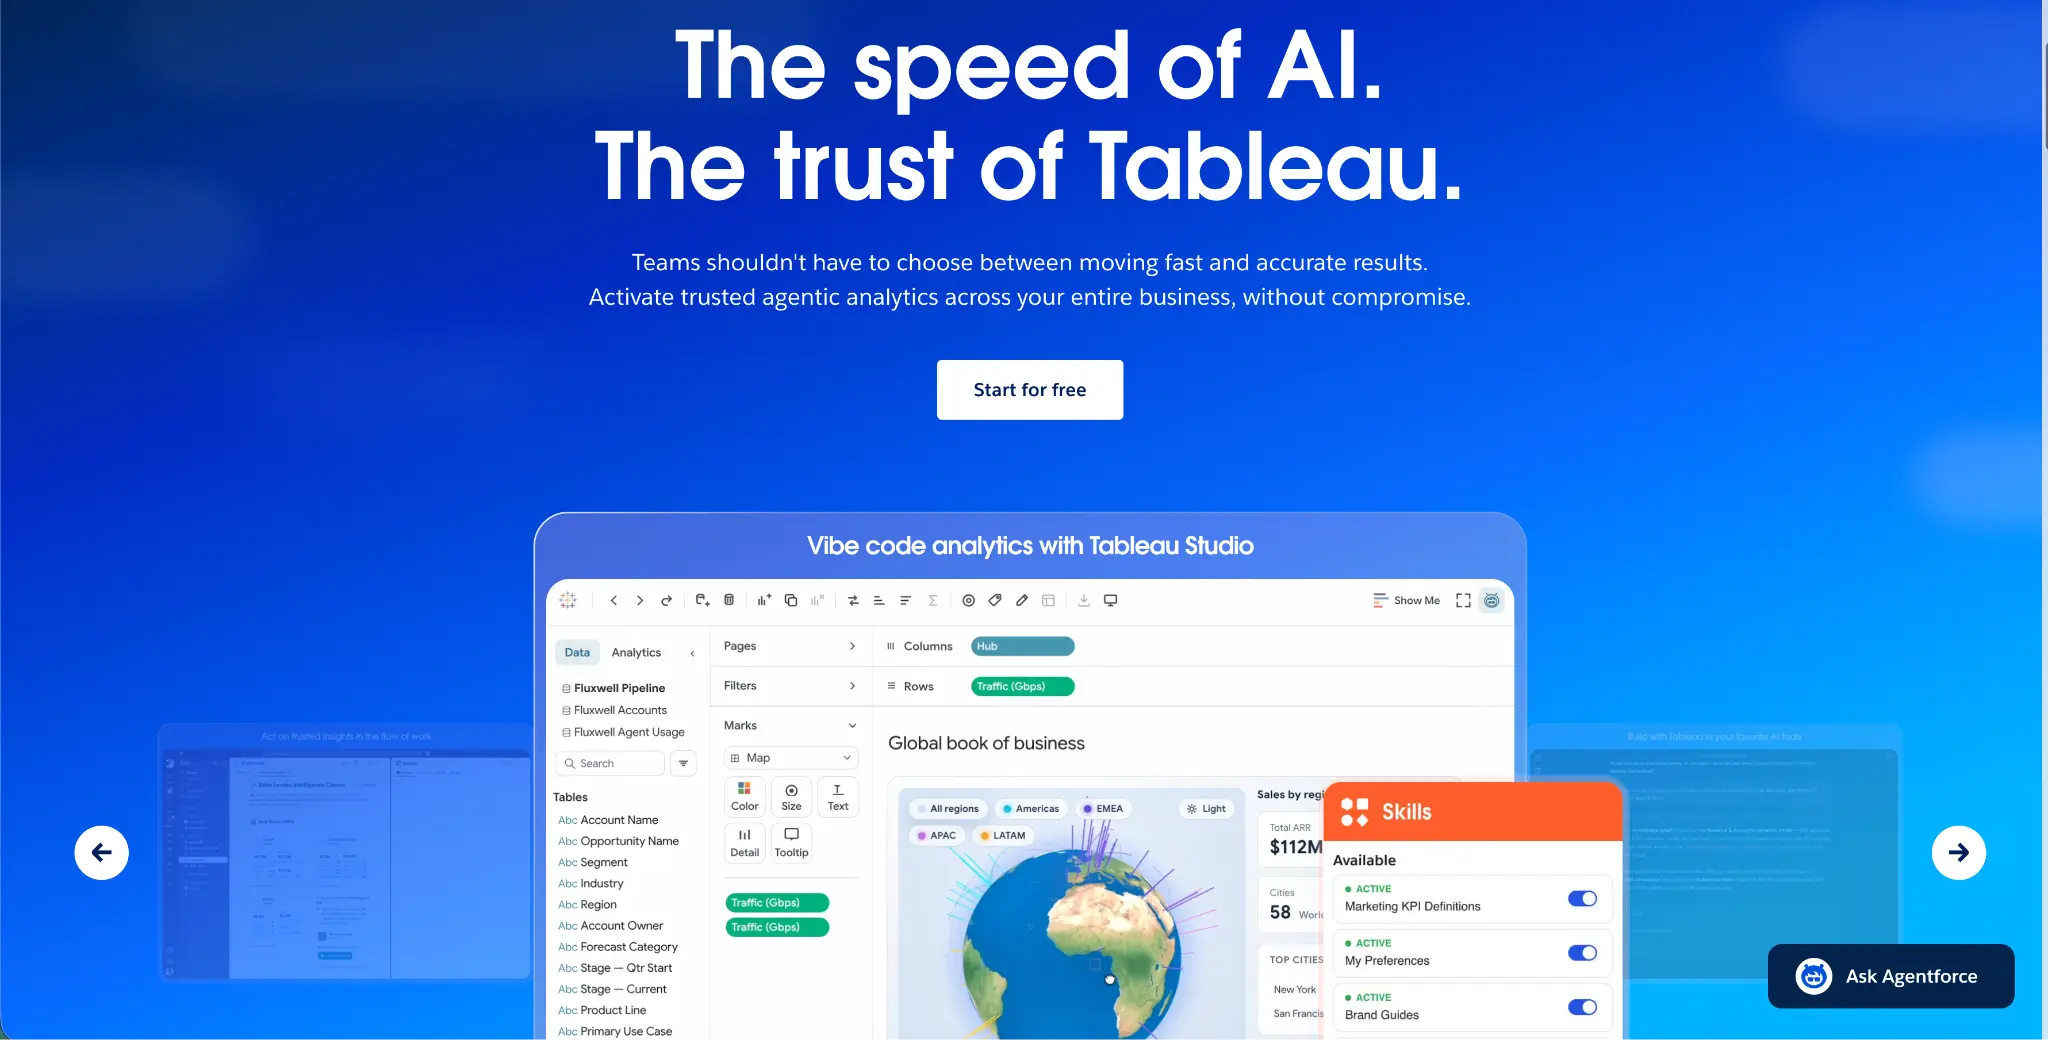
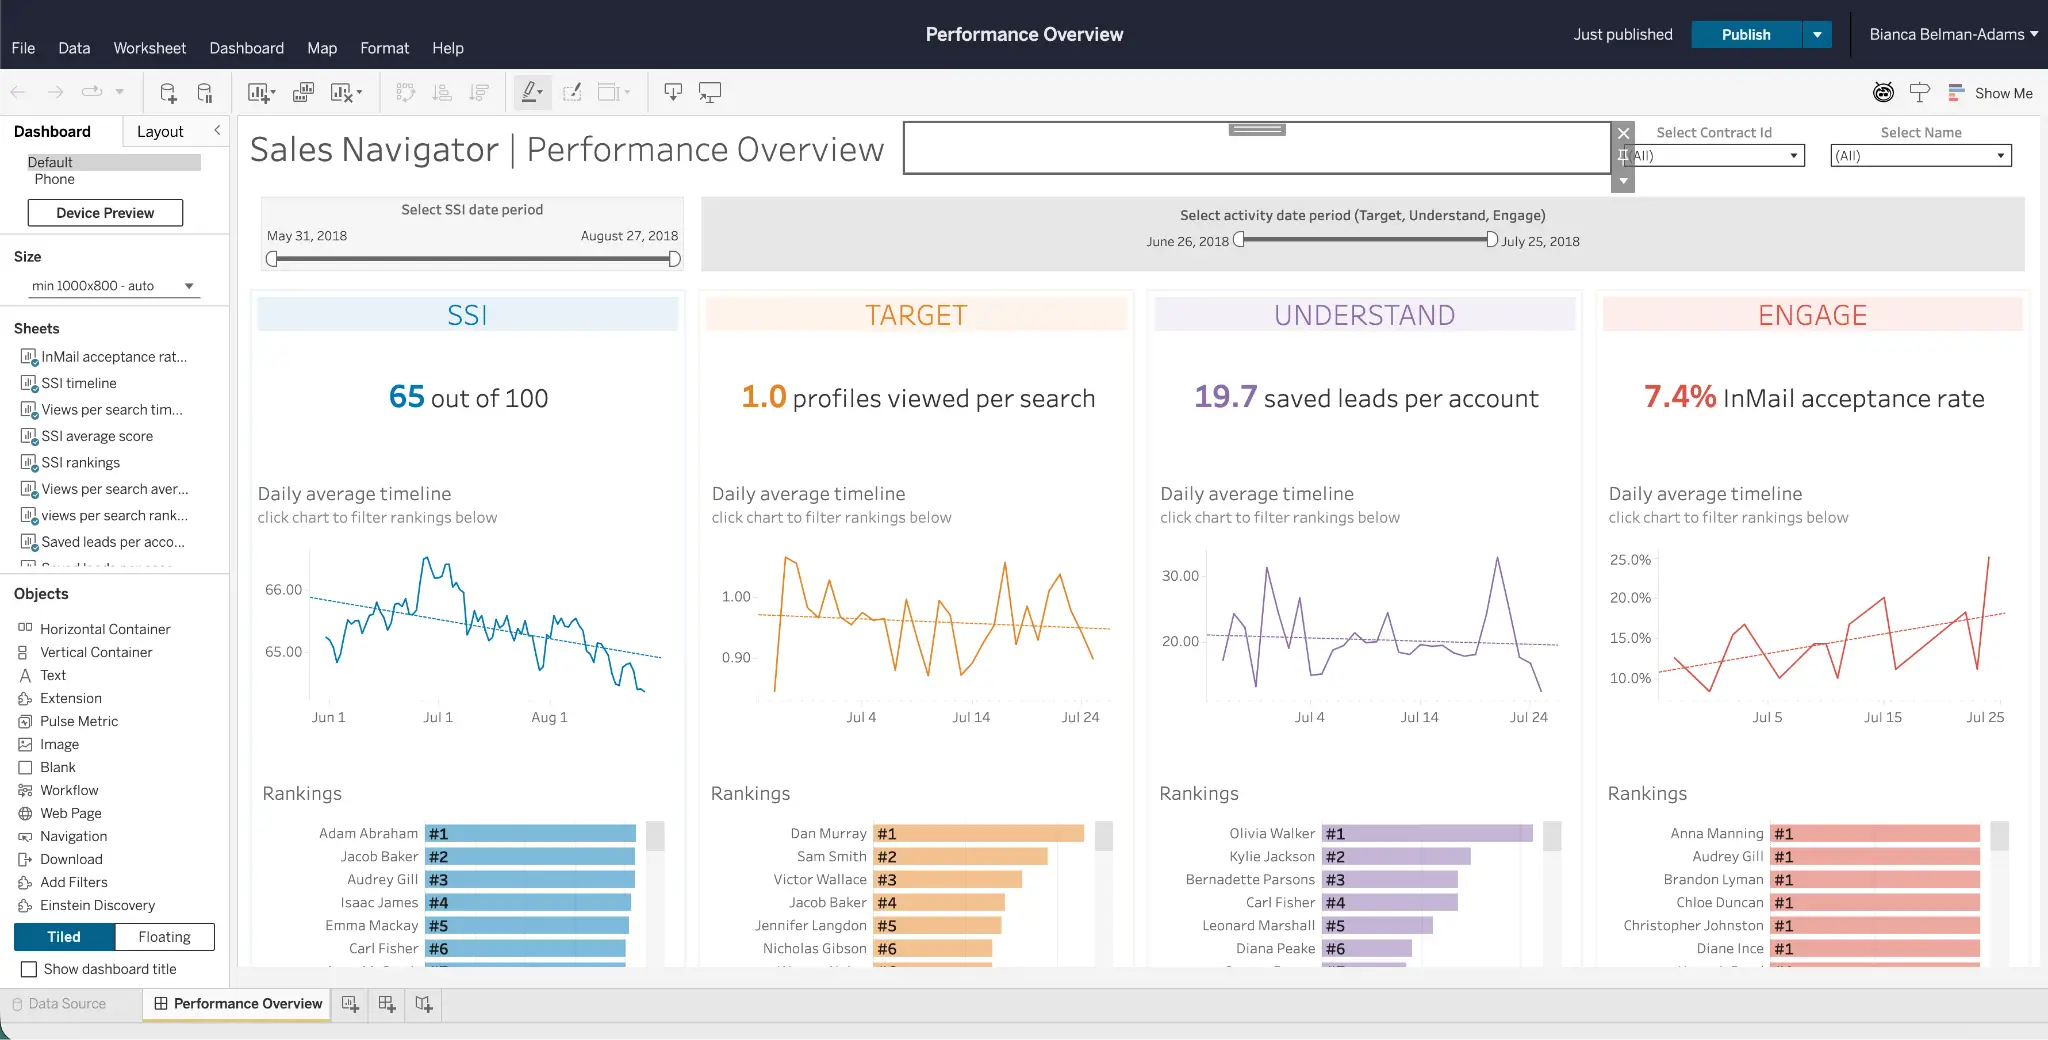
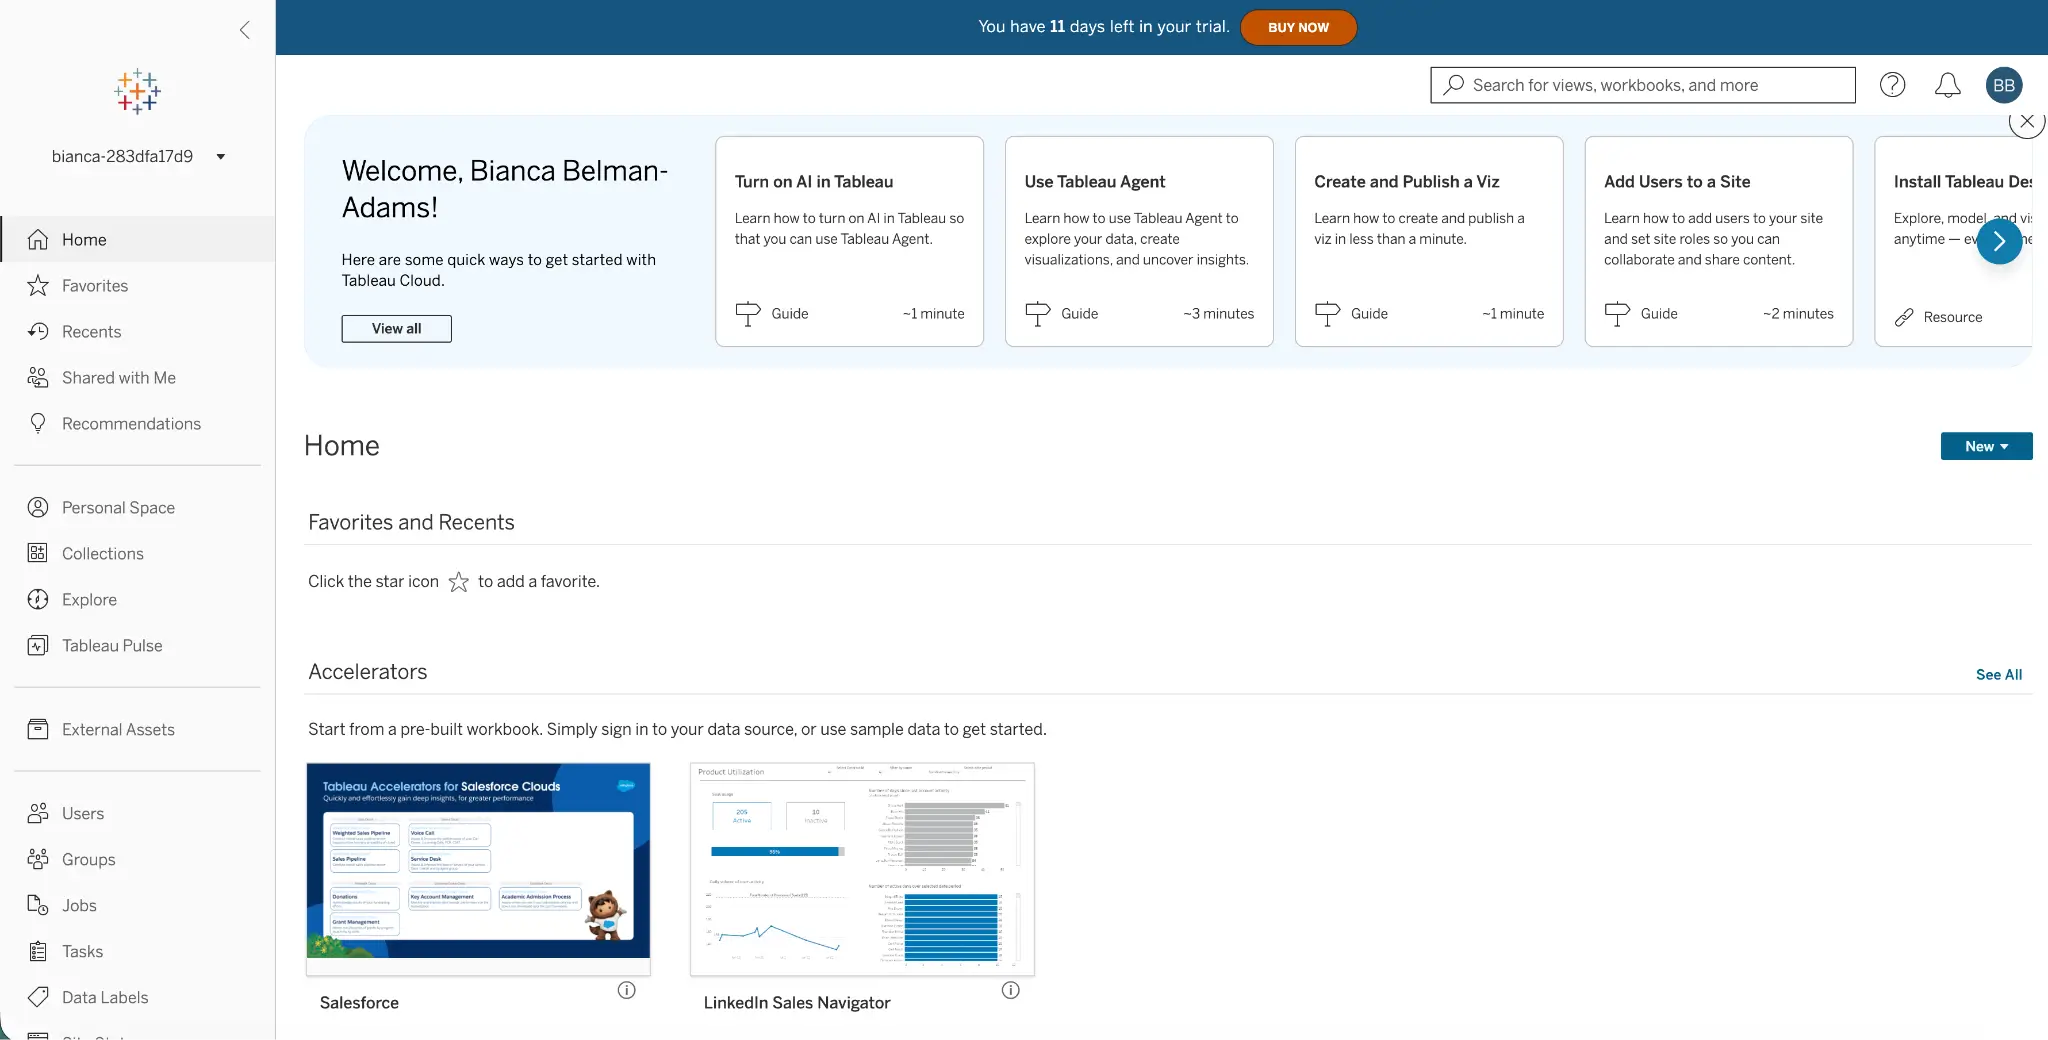
Tableau is a business intelligence and visualization platform researchers use to explore survey data and build interactive dashboards. It's particularly useful when survey results need to sit alongside other datasets or feed an ongoing tracker.
Key Features:
- Drag-and-drop analytics
- AI-powered recommendations
- Interactive dashboards
- Connections to multiple data sources
Strengths: Tableau is one of the most powerful visualization tools out there, and it's a standard in many data teams for good reason. It can combine survey results with other data sources, like sales, CRM, or web data, which makes it strong for trackers and for connecting survey findings to business outcomes. Once you've learned it, there's very little you can't build, and a large community means there's an answer or a tutorial for almost any problem.
Limitations: Tableau takes a long time to learn. Gal worked with it hands-on in a previous role and can vouch for that, and it's also one of the most repeated complaints in its G2 reviews. Reviewers also report that performance drops on large datasets, with several needing to optimize extracts just to keep dashboards responsive. Pricing is the other recurring issue: per-seat licensing gets expensive fast once you roll it out beyond a small team, and some reviewers find version control on workbooks too weak for team collaboration.
Best for: Research teams that need advanced survey dashboards, visualizations, or ongoing trackers.
Base44
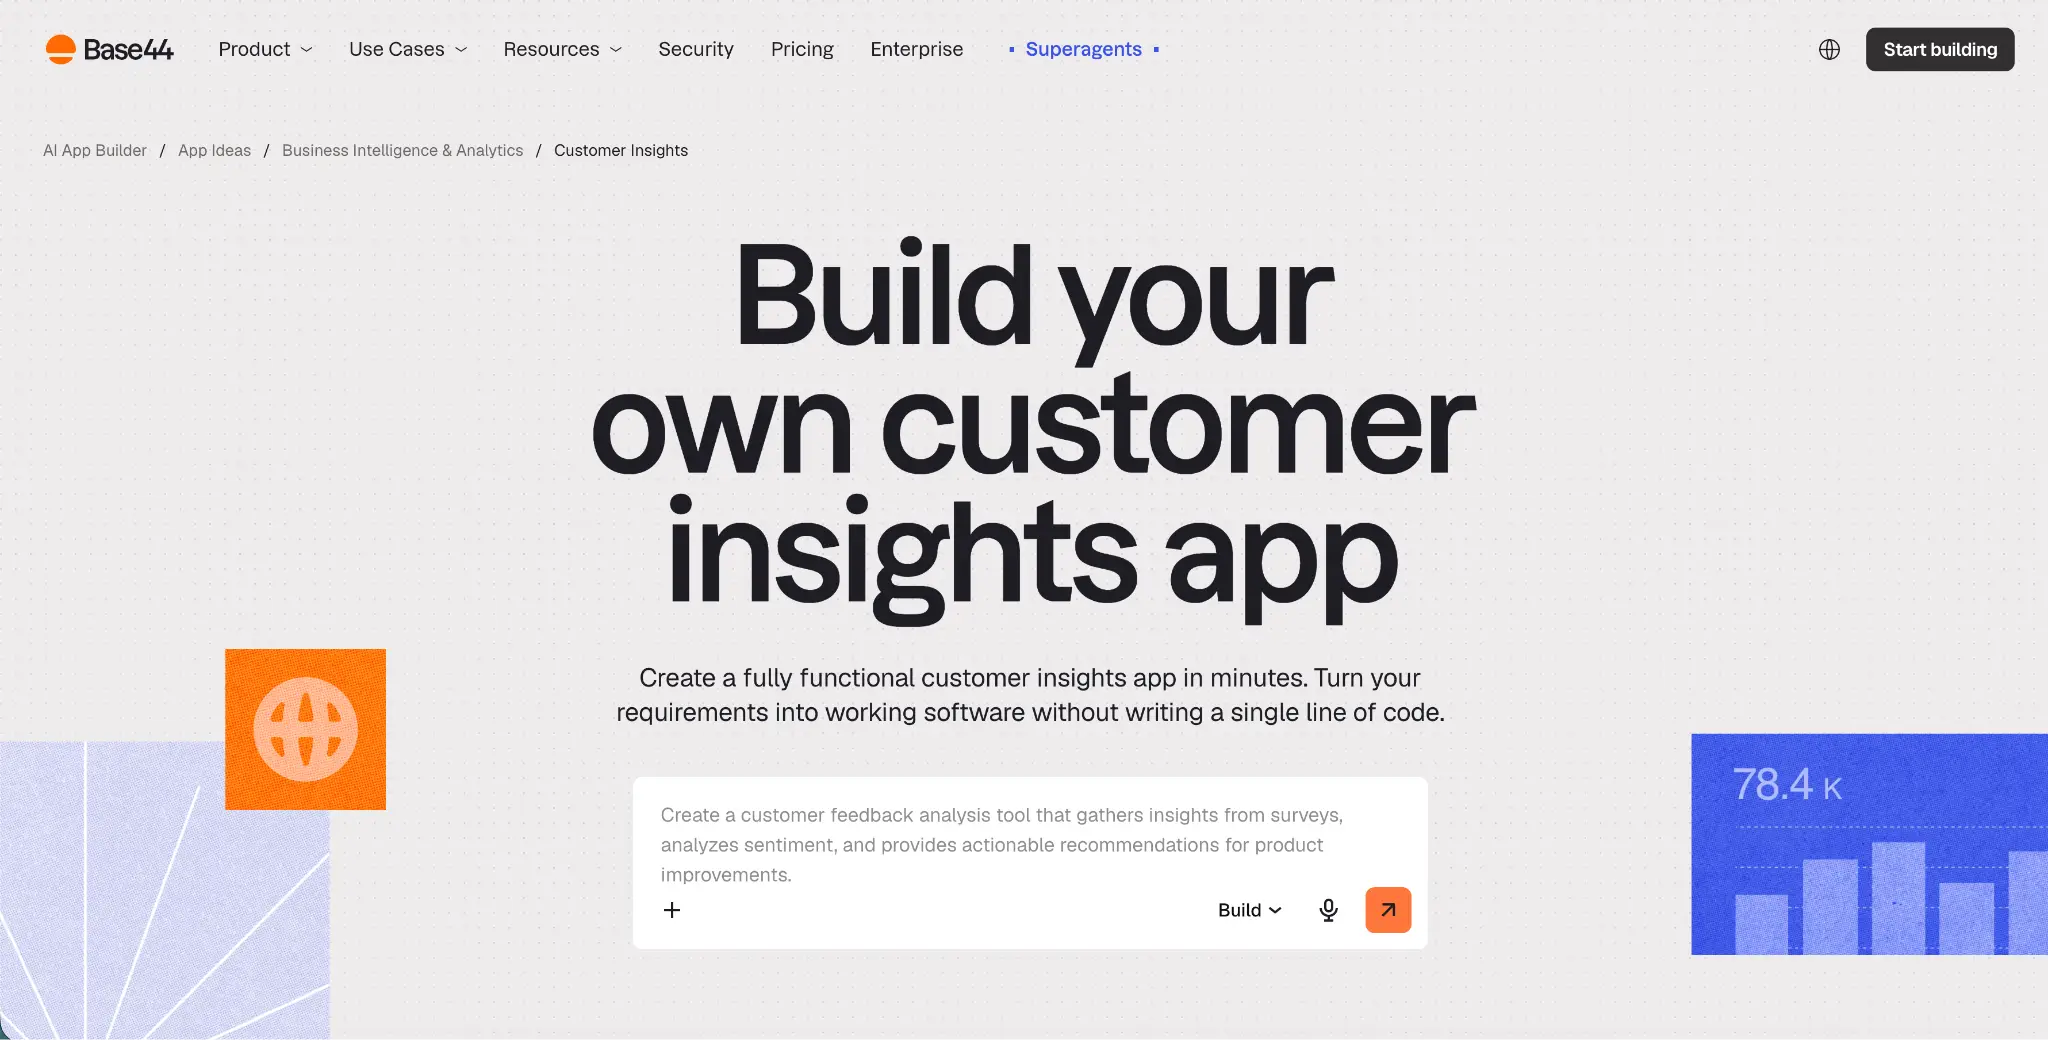
Base44 is an AI app builder. Instead of learning a dashboard platform, you describe the dashboard you want in plain language, and it builds it for you, including the data structure behind it. Want a filter by region or a different chart? You ask, and it changes.
Key Features:
- Builds dashboards and full customer insights apps from a plain-language description
- Edits by request, with no UI or platform to learn
- Automated reports that email key results to stakeholders on a schedule
- Connects to tools like HubSpot, Slack, and Zapier
- Database, login, and hosting built in, so the app is ready to share with your team or a client
- Free plan to get started
Strengths: Base44 turns building a dashboard, or even a full customer insights app, into a conversation. There's nothing to learn and no BI skills needed. You describe what you want and get a working, shareable app in minutes. Changes work the same way, so a round of client feedback doesn't mean another hour in a BI tool. Scheduled email reports also make it useful for trackers, since stakeholders get the latest results without anyone rebuilding a report each wave.
Limitations: Base44 gives you the building blocks, not a ready-made research method. You can add AI features like sentiment analysis to your app, but you're designing that analysis yourself, so there's no tested coding approach, codebook, or quality checks unless you build them. For anything that goes in front of a client, check that the numbers and charts are what you asked for. Pricing runs on credits, so the cost depends on how much you build and how much the app is used, and integrations require a paid plan.
Best for: Researchers and insight teams who want a custom, shareable dashboard or insights app for survey results, without learning a BI platform.
Best for Academic & Scientific Statistical Analysis
IBM SPSS Statistics
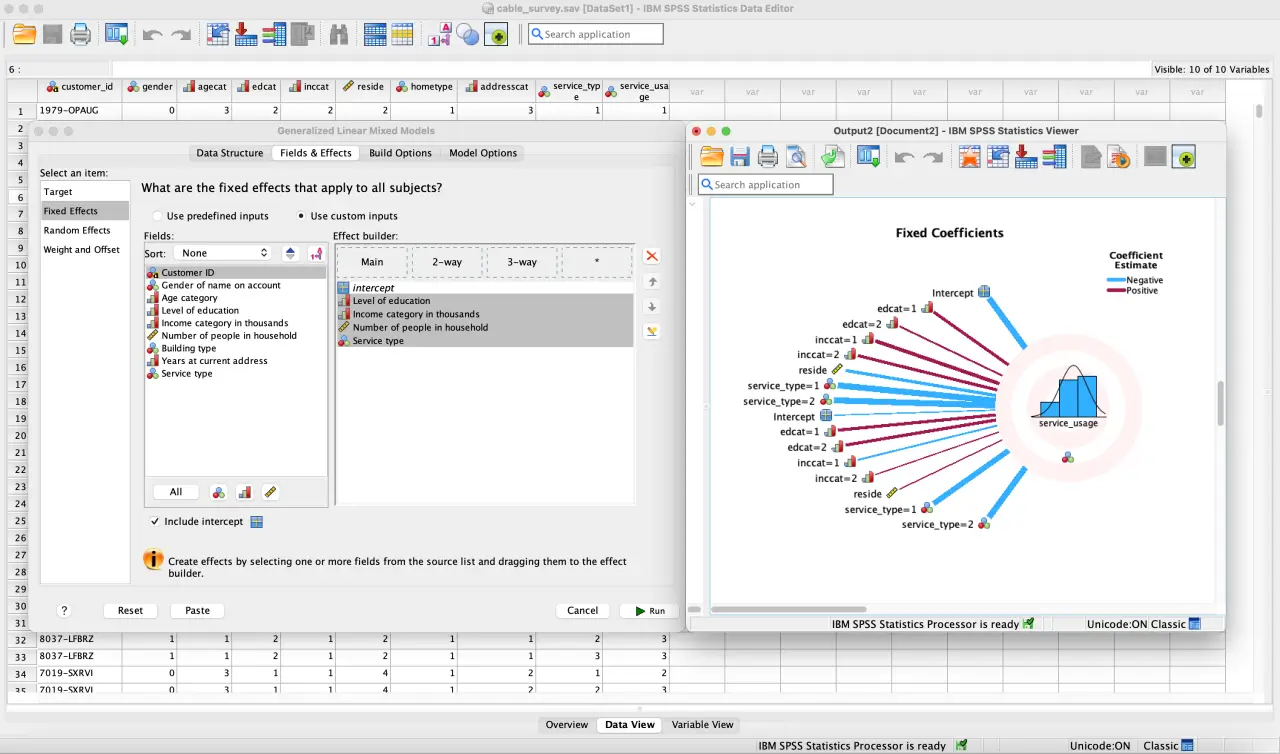
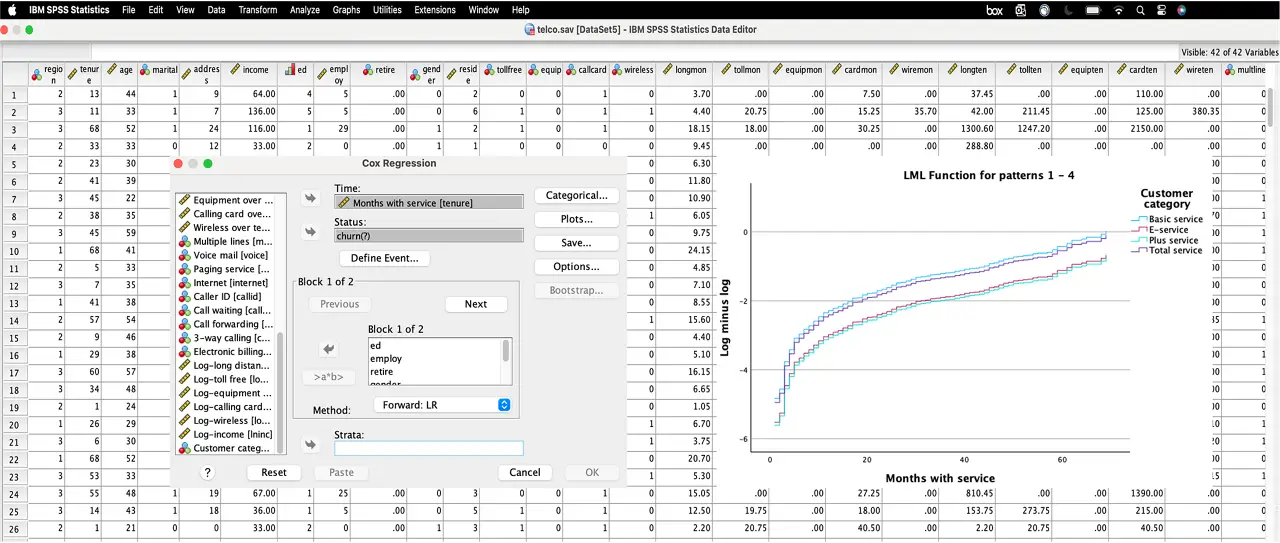
SPSS is a statistical analysis platform widely used in quantitative research. It supports regression, significance testing, descriptive statistics, and other statistical modeling commonly used on structured survey data.
Key Features:
- Advanced statistical modeling
- Regression analysis tools
- Designed for scientific and academic use
Strengths: SPSS is the tool most researchers trust for statistical analysis. It handles weighting, significance testing, regression, factor analysis, and much more, and it does it reliably. Its syntax lets you save and rerun an analysis exactly, which is useful for trackers and repeat studies. And because so many researchers learn it at university, it's easy to find people who already know how to use it.
Limitations: SPSS is the industry standard for statistical analysis for good reason: it's efficient, reliable, and widely trusted, and many universities give it to students for free. The trade-off is that it's showing its age. The interface and workflow haven't changed much in years, and there's no built-in AI to speed up the work. If you or your team can write code, R and Python offer more flexibility for the same kind of analysis, and they're free.
Best for: Researchers, universities, and analysts who need serious statistical analysis of quantitative survey data.
Best for Omnichannel Survey Analysis
Zonka Feedback
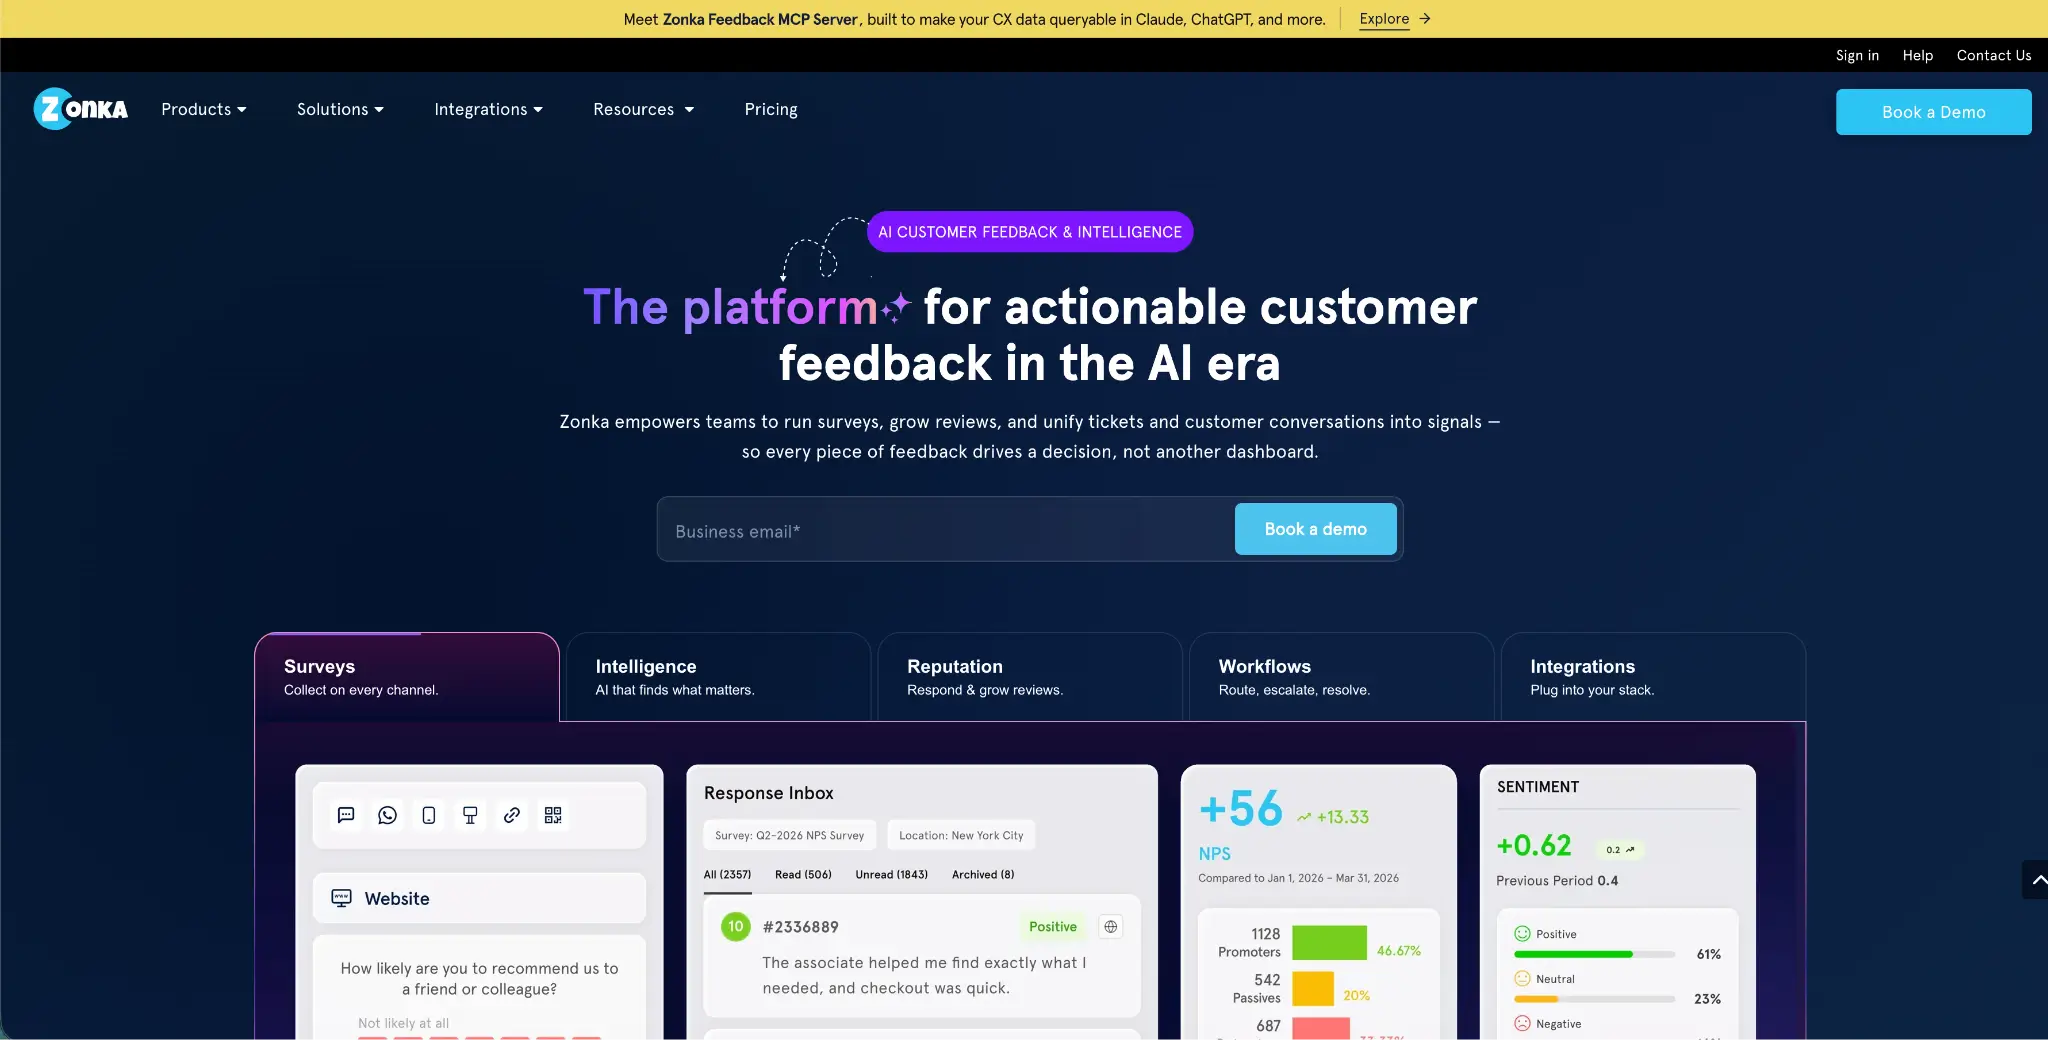
Zonka Feedback is a customer feedback platform that combines survey collection with analysis across multiple channels, email, SMS, WhatsApp, websites, apps, and kiosks, alongside dashboards and automated workflows.
Key Features:
- Omnichannel survey collection
- Real-time dashboards and trends
- Feedback analytics
- Automated alerts and workflows
Strengths: Zonka collects feedback wherever your customers are and brings it all into one place. NPS, CSAT, and CES surveys are built in and ready to go, and automated alerts let teams follow up on negative feedback quickly. It's also well liked by its users, with a 4.7/5 rating on G2.
Limitations: G2 reviews for Zonka Feedback are largely positive (4.7/5 across 83 reviews), but a few themes recur: some reviewers report occasional bugs or software instability, and pricing feels high for smaller businesses once you move past the entry tier. A few also note the tool doesn't support in-house call reviews, and language/translation options are limited outside English on lower plans.
Best for: Businesses and CX teams that need to collect and analyze feedback across multiple channels in one place.
Best for Ad Hoc AI-Assisted Analysis
ChatGPT
ChatGPT isn't a dedicated survey analysis software, but it can still support real parts of the research workflow. Researchers use ChatGPT for text analysis of interviews, exploring open-ended responses, summarizing themes, interpreting statistical output, or writing code for quantitative analysis.

Key Features:
- Brainstorm or refine survey questions
- Summarize open-ended responses
- Explore themes in qualitative feedback
- Interpret statistical output and cross-tabs
- Generate code for quantitative analysis
Strengths: ChatGPT is flexible, fast, and available to almost everyone. There's no setup and no learning curve. You paste in your data or ask a question and get an answer in seconds. It's useful across the whole research process: sharpening survey questions, getting a quick read on open-ended responses, explaining what a statistical output means, or writing R and Python code for analysis.
Limitations: In our experience, ChatGPT is great for a quick first exploratory look at your survey data, but it falls short once you need analysis you can report on. For open-ended text analysis counts and percentages are approximate at best, since it summarizes responses rather than coding each one, and on larger datasets it quietly skips or blends responses instead of going through every row. It also tends to sound confident even when it's wrong, so every output needs checking.
Best for: Researchers who want flexible, ad hoc AI support while exploring survey data.
Claude
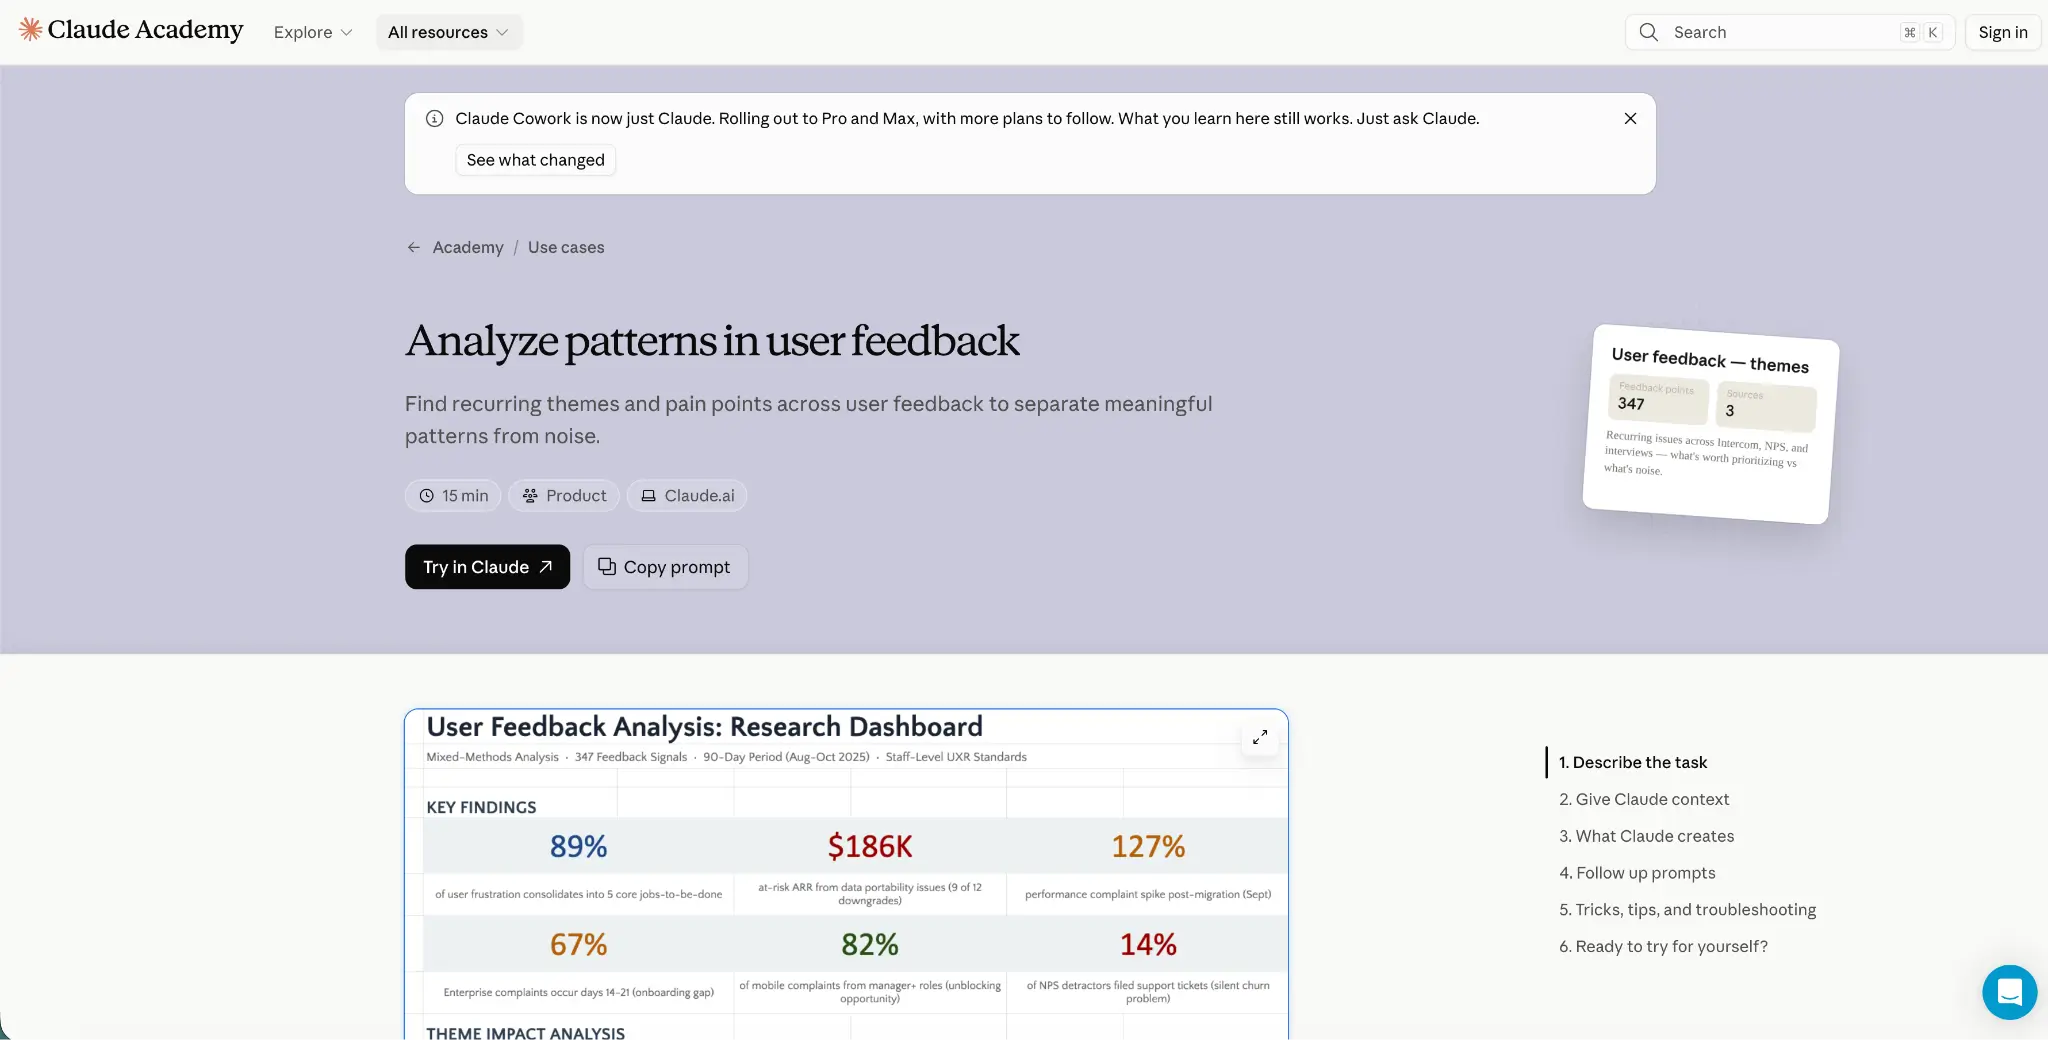
Claude is also a general-purpose AI assistant, not dedicated survey software, but its careful reasoning and data analysis modules make it a good fit for a slightly different job: working through large stretches of qualitative material in one pass, a long interview transcript, a big batch of open-ended responses pasted in at once, or a detailed set of coding instructions it needs to apply consistently across a document.

Key Features:
- Works directly with uploaded spreadsheets and files for lighter quantitative exploration
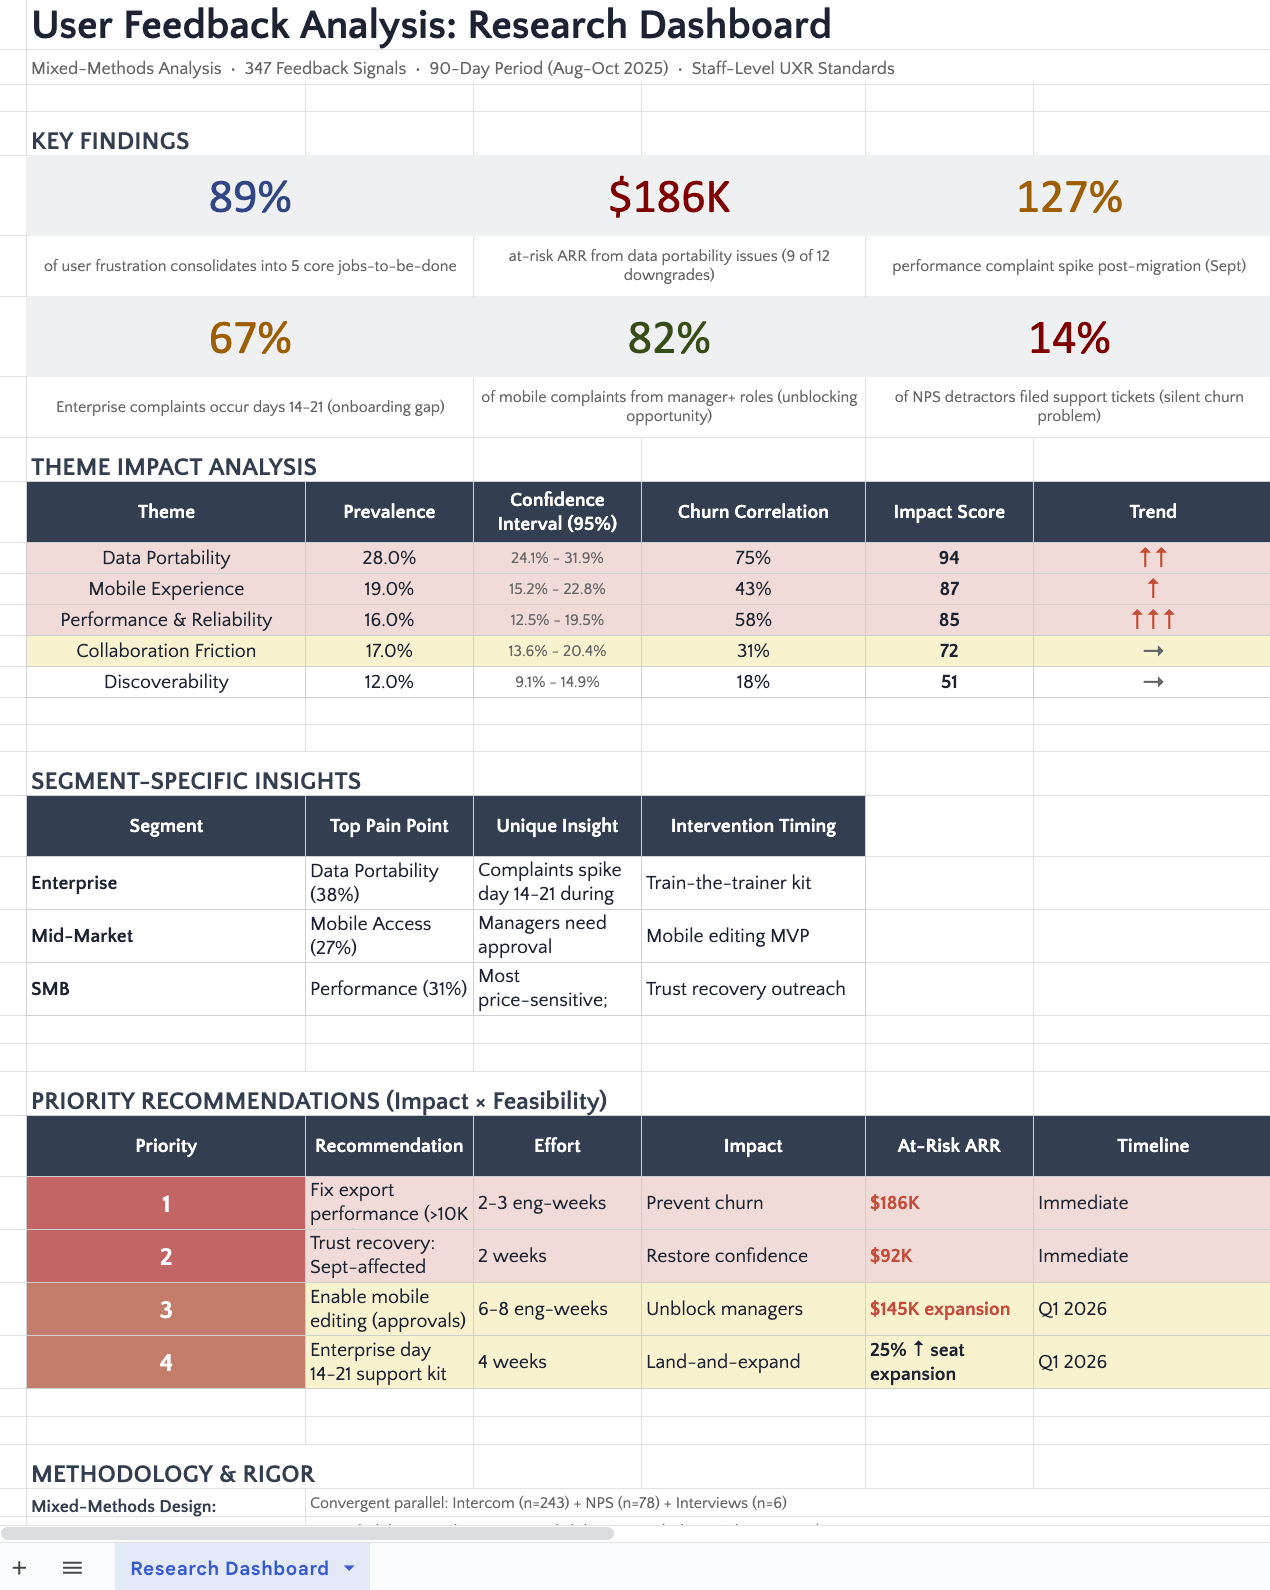
- Strong quantitative analysis and data visualization modules
- Connects directly to survey collection tools like Qaltrics or SurveyMonkey, so you can create surveys and analyze live response data without exporting anything.
- Builds interactive dashboards and charts from your data when you ask for one, with no BI tool to learn
Strengths: Claude is especially good with quant data. You can upload a spreadsheet and ask for a dashboard or chart, and it builds one for you, with no BI tool needed.
Limitations: Like other general-purpose AI assistants, Claude can hallucinate or give confidently incorrect answers, so outputs still need to be validated. The workflow is also difficult to standardize: results depend heavily on how the user prompts it each time, which makes repeatability and consistency harder across projects or researchers.
For open-ended text analysis, Claude may use keyword-based Python scripts rather than true semantic coding. That means it can look like the analysis worked, responses get labeled and themes are produced, but the quality can be much lower vs dedicated coding tools.
Best for: Researchers who want flexible quantitative analysis, data exploration, and quick custom visualizations, or who need to explore a qualitative dataset in a one-off, conversational workflow.
Best for Open-Ended & Qualitative Text Analysis
Blix
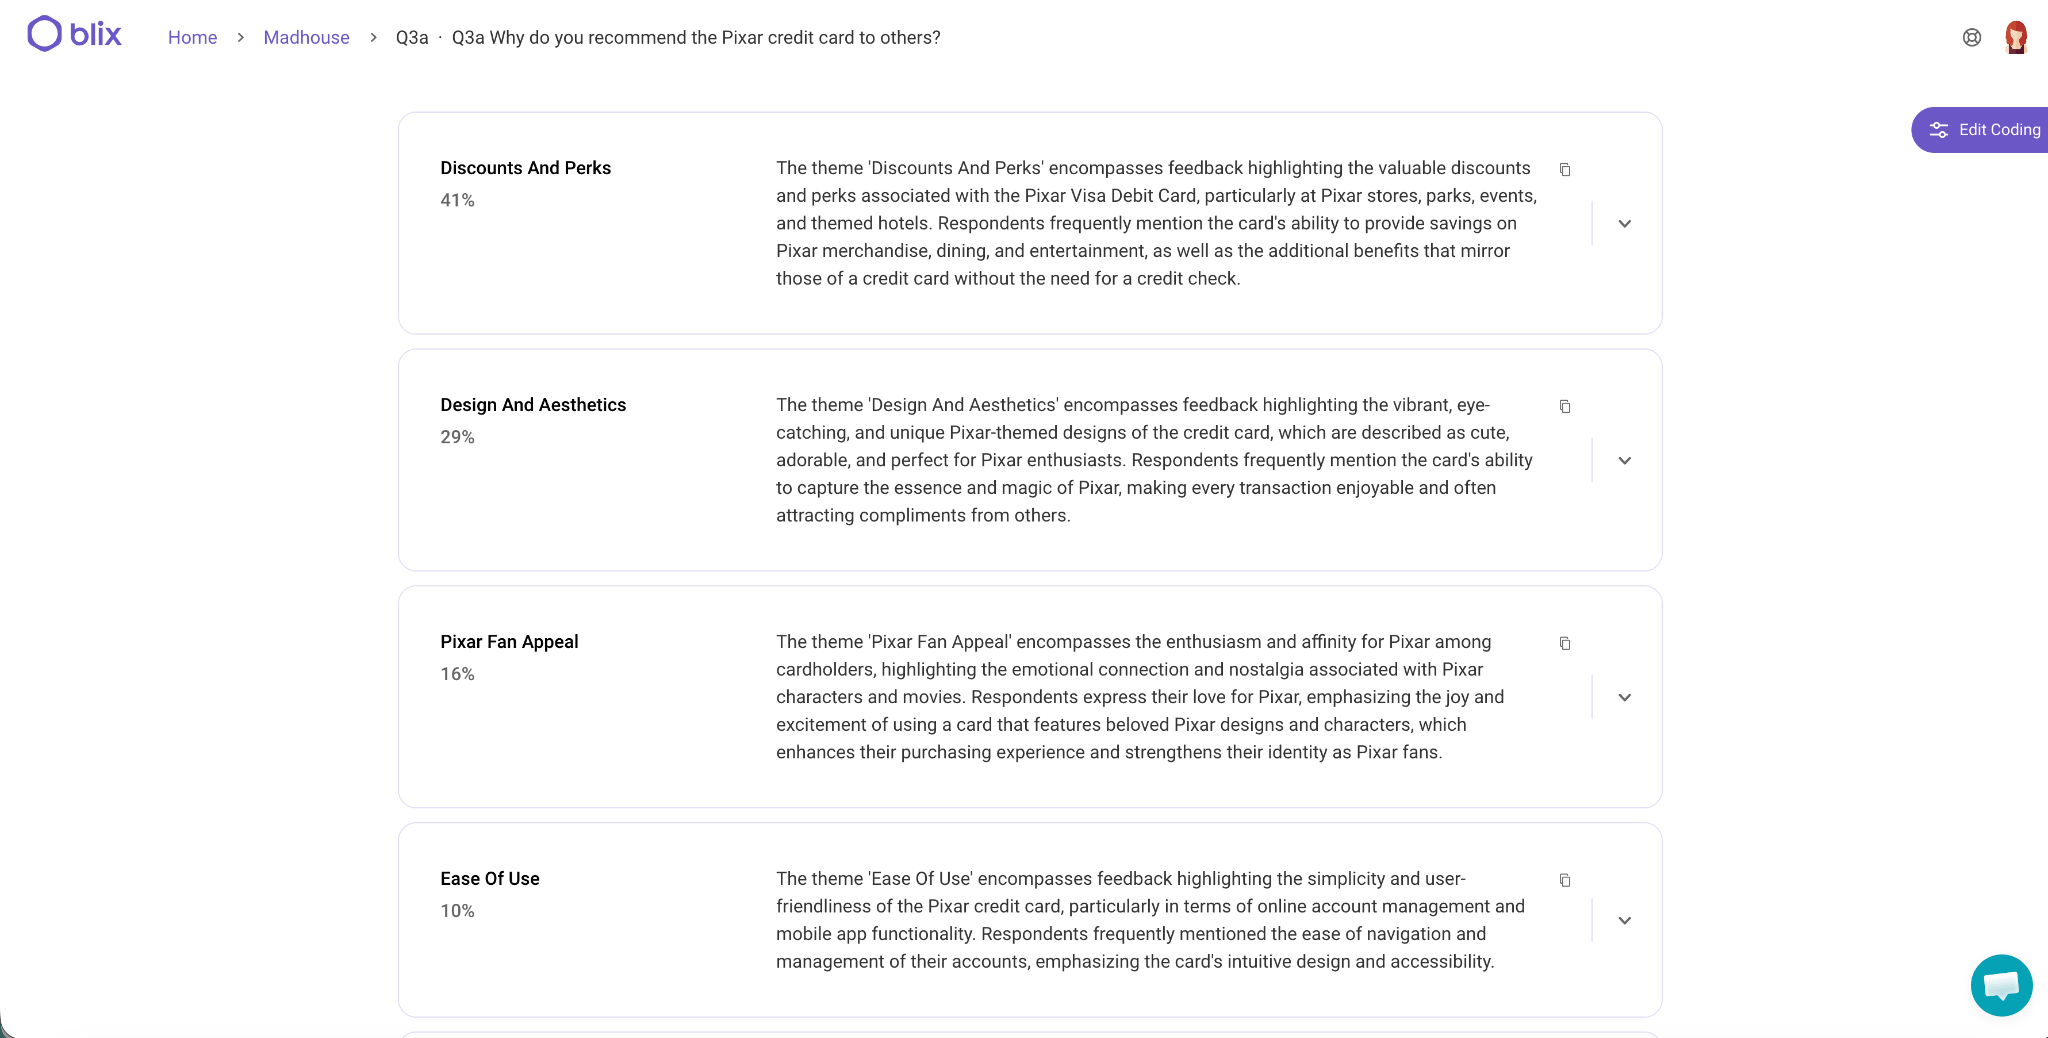
Blix is built specifically for researchers who need to get through open-ended responses at scale. Unlike broader platforms that bundle survey creation, statistics, dashboards, and text analytics together, Blix focuses on making verbatim analysis faster and easier to manage, though we're actively expanding into parts of quantitative analysis too.
Instead of matching keywords, Blix reads for the meaning behind a response. That means it can handle context, different ways of saying the same thing, spelling mistakes, sentiment, and multilingual responses, and it results in coding that lands in the 95-99% agreement range with trained human coders.
It's particularly useful for research teams that want the depth open-ended questions give you, without the manual coding workload that usually comes with it. As Gal puts it, open-ended analysis is "super important, but it's not scalable" once you're doing it by hand.

Key Features:
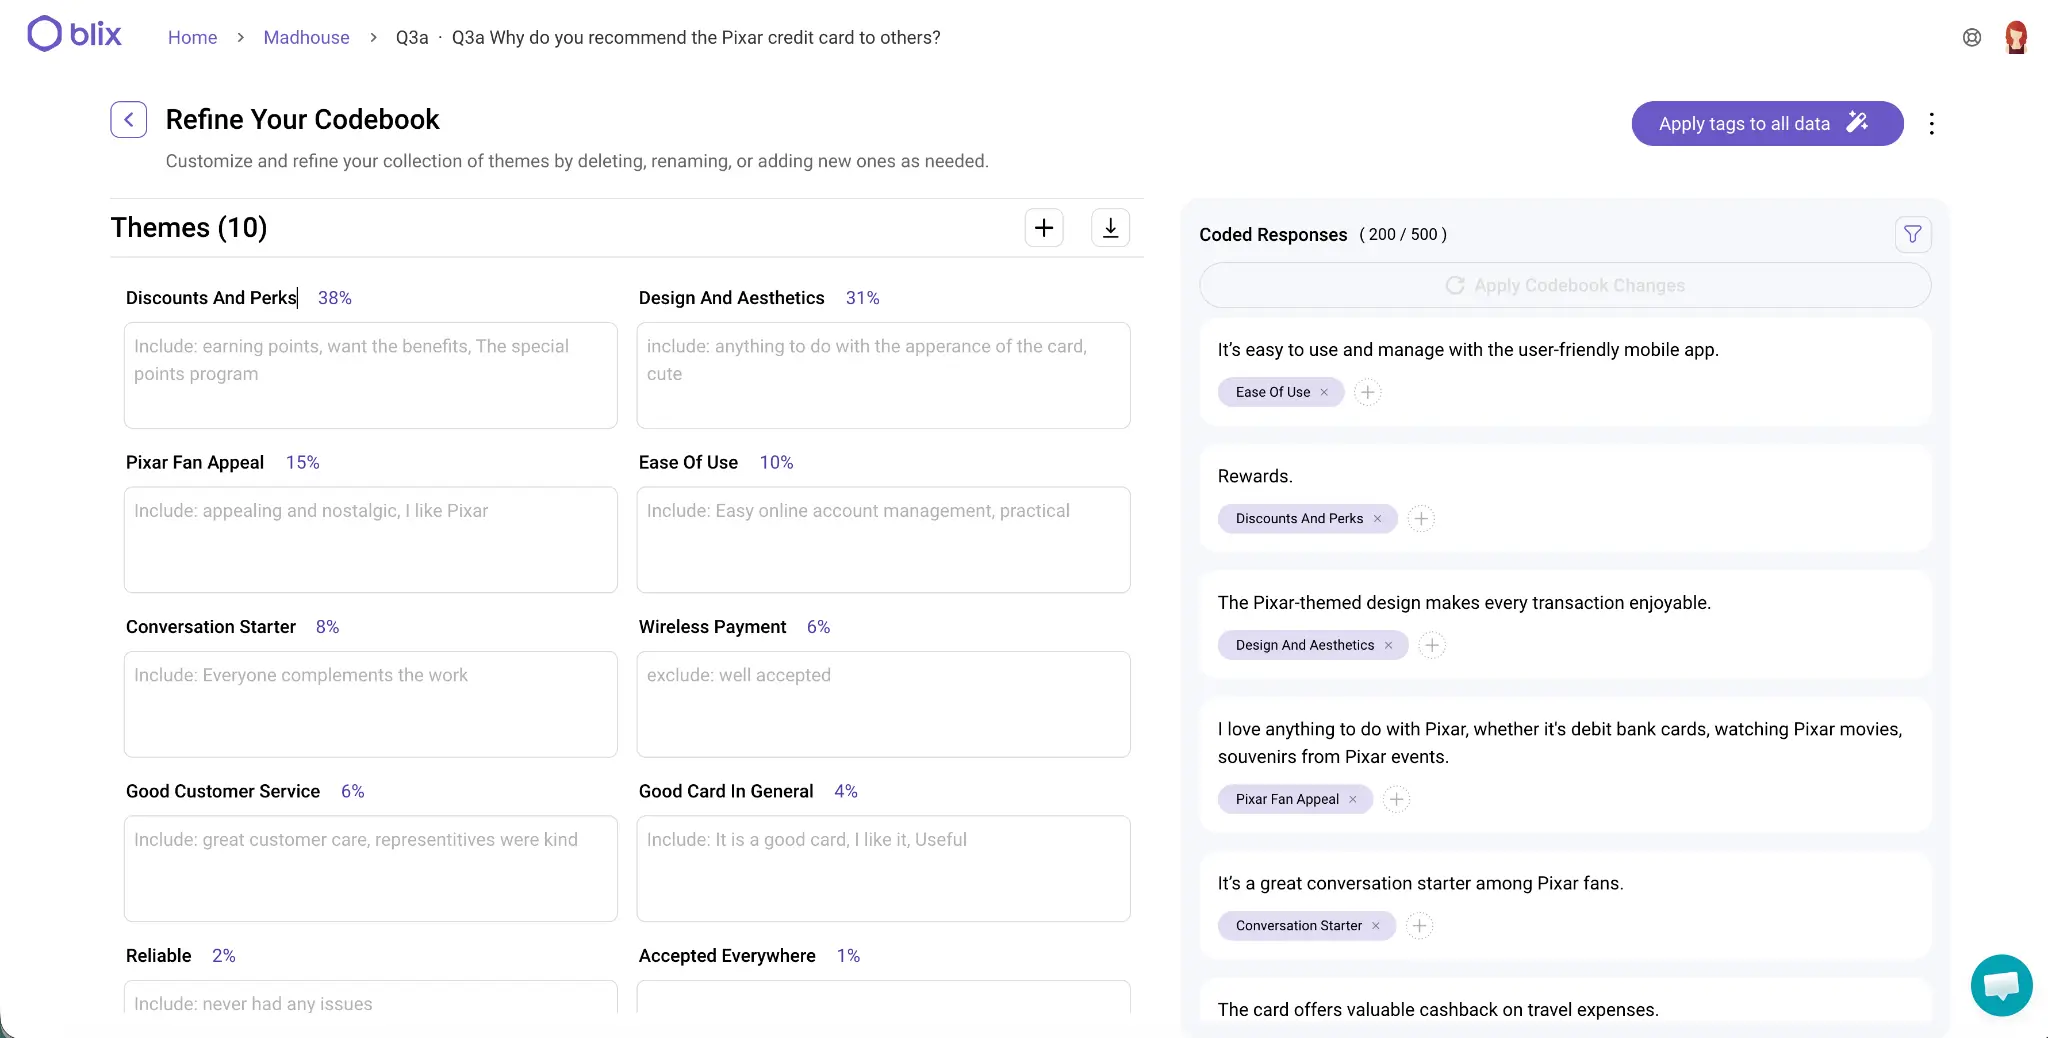
- Semantic coding. Reads for meaning, not keywords, so "too expensive" and "not worth the price" land under the same theme
- Quick, intuitive, and easy to use. No long onboarding or complex setup. Upload your data and get coded results in minutes
- Automated theme extraction. Builds a full codebook from your data automatically, so there's no blank page to start from
- Researcher control. Split, merge, rename, or fine-tune any theme with plain-language instructions
- Multilingual coding. Codes across a wide range of languages from one codebook, with no separate translation step
- Traceability. Every coded theme links back to the actual responses behind it, so you can check the work rather than take it on faith
- Text analysis API. Automate your text analysis and stream coded feedback straight into dashboards, reports, and workflows
- Flexible pricing. Subscription or pay-as-you-go
Strengths: Blix is built around three things: high-quality coding, speed, and being easy to use. Instead of matching keywords, it reads for the meaning behind a response, so it handles context, different ways of saying the same thing, spelling mistakes, sentiment, and multilingual responses, and it produces coding that lands in the 95-99% agreement range with trained human coders. There's little to configure or learn before you're actually doing the work. That matters most for research agencies running multiple studies, recurring trackers, or projects with hundreds or thousands of verbatim responses.
Limitations: Blix doesn't create, program, or field surveys. It's built for analysis, so you'll still need a survey platform to collect your data and then bring the responses into Blix. Open-ended coding is where it's strongest today, and we're expanding into more of the analysis workflow, so if your main need right now is advanced visualization or statistical modeling, a dedicated visualization or stats tool can be a better fit.
Best for: Professional researchers who need high-quality text analysis done quickly and easily, especially in market research agencies, insight teams, and customer experience teams.
Which Survey Analysis Tool Should You Choose?
Every tool on this list solves a different problem, so the right choice comes down to fit, not the longest feature list. Find the row that matches your main need, shortlist two or three tools, and test them on a real project before you commit.
If Open-Ended Responses Are Your Bottleneck
Every tool on this list solves a different problem, so the right pick comes down to where your analysis slows down. For a lot of research teams, that's the open-ended questions.
Open-ended questions give you some of the best feedback in a survey, the honest, unprompted kind you can't get from a rating scale. The problem is everything that comes after: turning hundreds or thousands of free-text answers into something you can actually report on. Most of the tools above treat that as a side feature.
That's what Blix is for. It codes large volumes of open-ended survey responses in minutes instead of days, with human-like accuracy.
If manual coding is slowing your team down, book a demo and try it on your own survey data.
FAQs
Survey analysis software is a tool that helps researchers organize, analyze, and interpret survey response data. Depending on the platform, this can include statistical analysis, cross-tabulation, data visualization, open-ended response coding, sentiment analysis, and reporting.
There's no single best survey analysis software, the right choice depends on your bottleneck. Quantitative platforms like SPSS focus on statistics, visualization tools like Tableau focus on dashboards, and specialized tools like Blix focus on one task, such as coding open-ended responses, in depth.
Yes, modern AI tools can code open-ended survey responses with accuracy close to human coders. Large language models read for meaning rather than matching keywords, so they correctly handle sarcasm, typos, and different phrasings that older keyword-based tools typically miscode.
Blix is an analysis tool. It's the strongest fit for research agencies and insight teams who already collect data and whose main bottleneck is analyzing it, especially coding large volumes of open-ended responses.