Are you looking to uncover key insights that drive strategic decision-making?
Do you have qualitative data but need a better way to analyze and interpret it?
Or perhaps you want to identify patterns and trends to improve outcomes, whether in customer engagement, product development, or market positioning?
Every business, research team, and organization collects data—but numbers alone don’t tell the full story. Metrics like sales figures, conversion rates, and churn percentages can describe what is happening, but they don’t explain why it’s happening.
That’s where qualitative data comes in. Open-ended responses give more context to why customers feel the way they do.
Think about the last time you analyzed an online review or listened to product feedback. Beneath the words lie insights that numbers can’t measure, but that are essential for refining strategies, improving experiences, and driving growth.
That’s where qualitative data analysis (QDA) becomes invaluable, turning unstructured data into actionable understanding.
In this guide, you’ll discover:
- What qualitative data analysis is and how it works
- Why qualitative insights are essential for businesses and researchers
- The different methods and tools used in QDA
- How to analyze qualitative data step by step
Let’s dive in and explore how qualitative data analysis can help you unlock powerful insights—allowing you to make smarter, more informed decisions.
Survey Coding made easy with Blix
Use Blix’s AI-powered survey coding software to gain actionable insights quickly & easily.
What Is Qualitative Data Analysis?
Qualitative data analysis (QDA) is the process of examining non-numerical data to identify patterns, themes, and insights that help you understand behaviors, emotions, and decision-making processes.
QDA helps you dig deeper into human behavior, motivations, and perceptions, giving you a richer understanding of your audience.
Unlike spreadsheets filled with statistics, qualitative data is text-based, visual, or auditory—often coming from real conversations, experiences, and feedback. Instead of measuring how many people do something, QDA helps you uncover why they do it and how they feel about it.

How Qualitative Data Analysis Differs from Quantitative Analysis
While quantitative data is structured, numerical, and easy to measure, qualitative data is unstructured and requires interpretation. Numbers can tell you what’s happening, but qualitative analysis explains why it’s happening.
For example, let’s say a product has a high churn rate. A quantitative approach might tell you that 30% of users cancel after three months—but it won’t explain why they leave.
A qualitative approach, such as analyzing customer exit interviews or support tickets, can reveal whether users are frustrated by the onboarding process, pricing, or missing features.
This is different from quantitative analysis, which answers “what?”, “when?” and “how many?”. Instead, qualitative analysis explores “why?” and “how?”, giving you a deeper, more nuanced understanding of your audience.
Why Is Qualitative Data Analysis Important?
As businesses and researchers seek to understand human behavior beyond numbers, qualitative data analysis is more important than ever.
QDA allows you to tap into the human psyche and optimize strategies for greater impact. As Edward Bernays, the “father of marketing psychology,” theorized—building upon the research of his uncle, Sigmund Freud, in A General Introduction to Psychoanalysis—understanding emotions and subconscious motivations leads to stronger, more influential messaging.
Qualitative data analysis transforms information from interesting to compelling. Companies use it to improve customer experience, refine product development, enhance marketing strategies, and inform user research—helping them make data-driven decisions with real-world context.
How Qualitative Data Analysis Drives Better Decisions
- Understanding Customer Behavior – Numbers tell you how many customers abandoned their cart; qualitative data tells you they left because the checkout process felt confusing or shipping costs were too high.
- Improving Product Development – User feedback from interviews and reviews can reveal hidden frustrations, helping teams design features that actually solve problems.
- Shaping Business Strategies – Qualitative insights help brands refine their messaging, optimize marketing campaigns, and create experiences that truly resonate with their audience.
The Rise of AI in Qualitative Research
Traditionally, qualitative research was a manual, time-consuming process. Researchers had to transcribe interviews, categorize responses, and tag recurring themes—all by hand. Now, AI-powered tools make qualitative research scalable, just like quantitative data analysis.
With advancements in AI-driven transcription, sentiment analysis, and natural language processing (NLP), businesses can quickly analyze large volumes of qualitative data—without losing depth or nuance.
This shift allows you to uncover trends and insights at scale, making qualitative analysis a powerful tool for both small businesses and enterprise-level organizations.
For example, Blix makes it easy to transform open-ended survey responses, online reviews, and other text feedback into actionable business insights with AI-powered analysis. Our platform automatically identifies key themes, categorizes responses, and generates instant reports, ensuring no valuable insight is missed.
With Blix, you can turn unstructured text into structured data effortlessly, helping your team make informed decisions faster.

Examples of Qualitative Data
You’re probably already collecting qualitative data in different ways. Here are some common examples:
- In-Depth Interviews (IDIs) – One-on-one conversations that explore personal opinions, experiences, and motivations.
- Open-Ended Survey Responses – Written responses that go beyond multiple-choice answers, offering rich insights. Learn how to code open-ended questions here.
- Social Media Comments & Discussions – Unfiltered opinions, trends, and sentiments shared online.
- Online Reviews & Customer Feedback – First-hand experiences shared by users about products, services, or brands. See our full guide to customer feedback analysis.
- Focus Group Discussions – Small-group conversations where participants share thoughts on a topic, product, or service.
- Chat & Support Interactions – Customer service conversations that reveal pain points and needs.
Each of these sources holds valuable insights—but without qualitative analysis, they can feel overwhelming and unstructured. That’s why QDA exists: to bring clarity to the chaos and turn raw data into meaningful insights.
Real-World Brands Using Qualitative Data Analysis
Many brands use qualitative data analysis to better understand their customers’ needs. Below are a few examples of how well-known companies leverage QDA to satisfy their audiences and stay at the forefront of trends, keeping them at the top of their industries.
LEGO: Rebuilding a Brand with Customer Insights
LEGO was once struggling with declining sales. Instead of guessing what kids wanted, they immersed themselves in their customers’ world, conducting in-depth ethnographic studies and parent-child interviews.
These qualitative insights led to new product lines and marketing strategies, helping LEGO reconnect with its audience and turn the brand around.
Dove: Transforming Marketing with Real Conversations
Dove’s groundbreaking “Real Beauty” campaign wasn’t built on traditional market research alone—it came from deep qualitative research. Focus groups and one-on-one interviews revealed that women felt alienated by unrealistic beauty standards.
By listening to their audience, Dove crafted a campaign that resonated deeply, building loyalty and reshaping beauty marketing.
Starbucks: Crafting Products Customers Actually Want
"In fact, segmentation is one of the best tools for market research because it provides unique data on demographics that can be used to create audience-specific marketing strategies.
For instance, Starbucks utilized a psychotropic segment to gain insights into customers' personal tastes, values, and lifestyle choices.
With this market research, Starbucks found a segment that prioritizes:
• Sustainability
• Health consciousness
• Plant-based lifestyle
• Allergies
As a result, Starbucks was then able to cater to that group through organizational values for sustainability and multiple options for non-dairy milk at each location.
Going one step further, they evaluated customer feedback to learn what locations required more non-dairy options than others.
This insight helped Starbucks to determine where they needed to purchase more non- dairy inventory and where they could purchase less."
Starbucks doesn’t just track sales—they listen. Through customer interviews and in-store observations, they discovered that people wanted more dairy-free options.
This insight led to an expanded menu of almond, soy, and oat milk alternatives, increasing customer satisfaction and broadening their appeal.
Methods of Qualitative Data Analysis
When diving into qualitative data analysis, it’s essential to choose the method that best aligns with your research goals and the nature of your data. Let’s explore some of the most common methods, highlighting when each is most appropriate.
Method 1: Thematic Analysis & Grounded Theory
What It Is:
Thematic analysis (similar to Grounded Theory) involves identifying, analyzing, and reporting patterns (themes) within data. It’s a foundational method in qualitative research due to its flexibility and accessibility.
When to Use It:
Opt for thematic analysis when you aim to explore common themes across a dataset, especially if you’re new to qualitative research. It’s suitable for various data types, including interviews, focus groups, and open-ended survey responses.
Example:
A company analyzing customer feedback to identify recurring themes about product satisfaction or areas needing improvement.
Method 2: Narrative Analysis
What It Is:
Narrative analysis focuses on the stories people tell, examining the sequence and structure to understand how individuals make sense of their experiences.
When to Use It:
Choose narrative analysis when your research centers on personal accounts or life histories. It’s ideal for understanding individual perspectives and the meanings they assign to their experiences.
Example:
Analyzing interviews with patients to understand their journey through a healthcare system.
Method 3: Discourse Analysis
What It Is:
Discourse analysis studies language use beyond the sentence level, focusing on the context and meaning in communication. It examines how language constructs social realities and power dynamics.
When to Use It:
Opt for discourse analysis when interested in the role of language in a specific context, such as political speeches, media articles, or organizational communications.
Example:
Analyzing corporate communications to understand how companies frame their environmental responsibilities.
Choosing the Right Method
Selecting the appropriate qualitative analysis method depends on your research question, the nature of your data, and your objectives. Here’s a quick guide:
- Thematic Analysis: For identifying common themes across data.
- Narrative Analysis: To delve into personal stories and experiences.
- Discourse Analysis: To explore language use and its implications in context.
By aligning your method with your research goals, you can uncover rich, meaningful insights that drive informed decisions.
The Qualitative Data Analysis Process
Now that you know why qualitative data analysis (QDA) is so powerful, let’s walk through how to actually do it.
Unlike quantitative analysis, which relies on predefined formulas and statistical models, qualitative analysis is more interpretive and exploratory. But don’t worry—it follows a structured process to help you make sense of unstructured data.
Here’s how you can go from raw conversations, comments, and feedback to meaningful, actionable insights.
Step 1: Data Collection - Gathering the Right Insights
The first step in qualitative data analysis is collecting meaningful data. This can come from:
- In-depth interviews (IDIs) – One-on-one conversations that explore personal experiences, motivations, and thoughts.
- Focus groups – Group discussions where participants share insights on a topic, product, or service.
- Open-ended surveys – Instead of just “yes/no” or multiple-choice answers, these allow respondents to express their thoughts freely.
- Social media conversations – Comments, discussions, and online reviews provide raw, unfiltered feedback from real customers.
- Customer support interactions – Chat transcripts, emails, and service calls often reveal pain points and frustrations.
💡 Pro Tip: Choose your data collection method based on your research goals. If you want deep personal insights, go for in-depth interviews. If you want to see trends across a broader audience, social media and survey responses are great options.
Step 2: Data Preparation - Cleaning and Organizing Raw Data
Once you’ve collected qualitative data, it’s time to prepare it for analysis. Unlike numbers in a spreadsheet, raw qualitative data is messy—it might be in the form of recordings, transcripts, handwritten notes, or digital responses.
Here’s how to organize your data for easy analysis:
- Transcribe interviews and recordings – If your data is in audio or video form, convert it into text using tools like Otter.ai, Rev, or Descript.
- Standardize formats – Whether your data comes from emails, surveys, or chat logs, put everything into a structured document or database.
- Sort responses by category – For example, group customer complaints together, separate positive feedback, and highlight neutral comments.
💡 Pro Tip: The more organized your data, the easier it will be to spot trends and themes later.

Step 3: Coding and Categorization - Labeling Key Insights
This is where qualitative analysis starts to take shape. Coding is the process of labeling pieces of data with tags or categories, making it easier to identify patterns.
How coding works:
- Read through your data carefully – Look for recurring phrases, emotions, or behaviors.
- Assign “codes” to different insights – Codes are short labels that summarize a key idea. Example:
- “Too expensive” → Pricing concern
- “Hard to navigate” → Usability issue
- “Love the color choices” → Positive design feedback
- Group similar codes into broader categories – For example, if multiple people mention price-related concerns, you might create a category called “Cost and Value”.
💡 Pro Tip: You don’t need fancy tools to start coding—spreadsheets work just fine! But for larger projects, software like Blix, NVivo, MAXQDA, or Dovetail can help automate and visualize the process.
Step 4: Thematic Analysis - Identifying Trends and Patterns
Once your data is coded, it’s time to look for overarching themes. This step helps turn fragmented insights into clear, meaningful takeaways.How to identify themes:
- Look for repetition – Are certain words, concerns, or emotions showing up again and again?
- Find connections between categories – For example, if many users struggle with navigation AND checkout, those might be linked in a broader theme like “User Experience Challenges.”
- Identify contradictions – If some customers love a feature while others find it confusing, that’s an important insight to explore.
💡 Pro Tip: Don’t just look at what people say—consider how they say it. Tone and emotion matter just as much as the words themselves.
Step 5: Data Interpretation - Turning Themes into Actionable Insights
Now comes the most exciting part—making sense of your findings and using them to drive decisions.Ask yourself:
- What are the biggest takeaways from this data?
- How do these findings impact business, marketing, or product development?
- What changes should be made based on this feedback?
- How do these insights complement quantitative data we already have?
For example:
- If multiple customers mention that a checkout process is confusing, the action might be: Redesign the checkout flow for better usability.
- If people repeatedly express interest in a new feature, the action could be: Prioritize it in the next product update.
💡 Pro Tip: Present your findings in a clear, engaging way. Use quotes, examples, and even visual representations like word clouds, heat maps, or mind maps to make insights more digestible for stakeholders.
Tools for Qualitative Data Analysis
Embarking on qualitative data analysis can feel overwhelming, but the right text analysis tools can make the journey smoother. Let’s explore some popular software options that can help you organize, code, and interpret your qualitative data effectively.
1. Blix
Blix is a user-friendly qualitative data analysis tool designed to streamline the research process of open ended survey responses, online reviews & social media sentiment, and support interactions. It offers features like ai powered coding, theme identification, and collaborative capabilities, making it suitable for both individual researchers and teams.
Pros:
- Automated topic discovery.
- Quick & effortless AI-powered coding.
- Advanced sentiment analysis.
- Intuitive interface that’s easy to navigate.
- Facilitates collaboration with team members.
- Flexible pricing options.
- Automated reports and summaries.
Cons:
- Limited integration options with other tools.
2. NVivo
NVivo is one of the most popular qualitative data analysis tools on the market. It’s a more technical solution than some others and requires more training.
NVivo is best for tech-savvy customer experience and product development teams at mid-sized companies and enterprises.
Pros:
- Supports a wide range of data types, including text, audio, and video.
- Robust data visualization tools.
- Supports a wide range of integrations
- It is well known and accepted in the academic world
Cons:
- Steeper learning curve and outdated UI
- Lack of AI capabilities
- Higher cost compared to some other tools.
- Has performance issues with large databases
3. MAXQDA
MAXQDA is a qualitative and mixed methods data analysis tool. It allows researchers to organize, interpret, and evaluate multimedia and textual data, providing vital information that assists with market research.
Pros:
- User-friendly interface with intuitive design.
- Strong visualization capabilities, including mapping and modeling.
- Supports a variety of data formats.
Cons:
- While more user-friendly than NVivo, it still requires training to fully utilize its advanced features.
- While it provides some automated analysis tools, it lacks the advanced AI-driven contextual coding capabilities found in newer, AI-powered QDA tools.
- Can slow down when handling very large datasets or multimedia files, particularly on older computers.
4. ATLAS.ti
ATLAS.ti is a powerful tool for qualitative data analysis, offering a range of features to assist in coding, visualization, and reporting. It’s suitable for handling complex projects with large datasets.
Pros:
- Comprehensive coding tools with flexible options.
- Excellent data visualization and network mapping features.
- Supports collaboration among team members.
Cons:
- Can be resource-intensive, potentially affecting performance.
- Some users report a steeper learning curve.
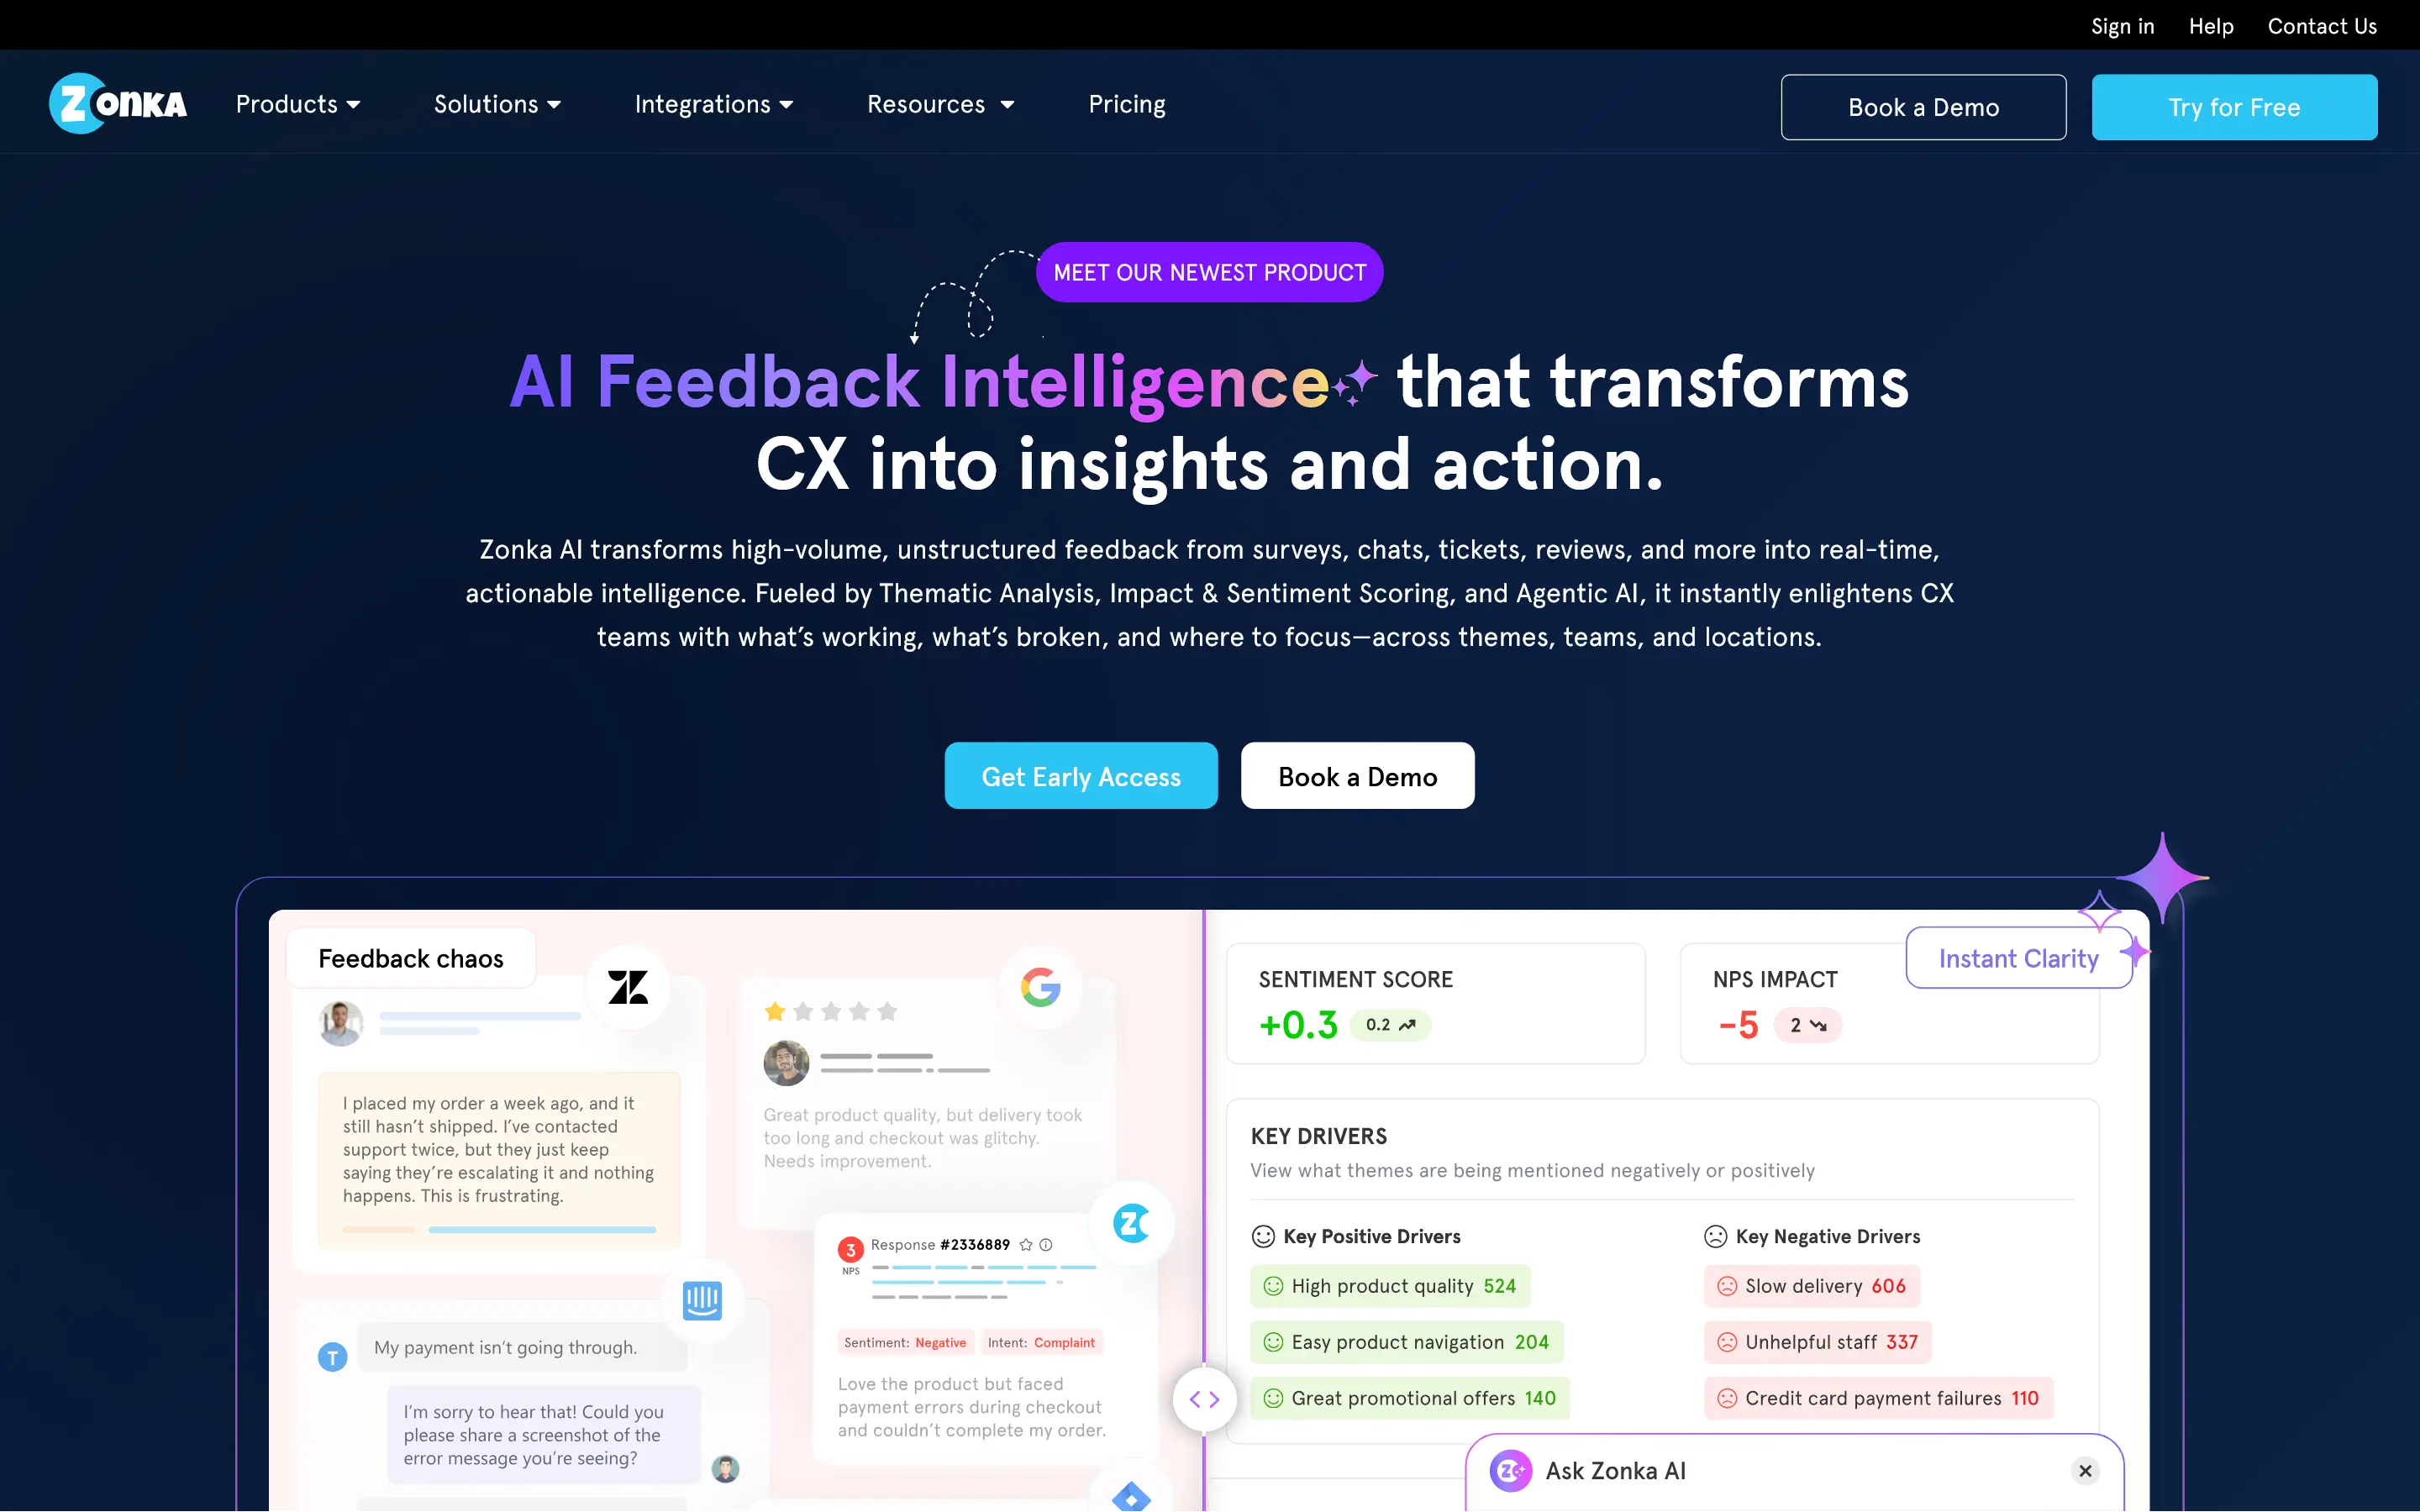
5. Zonka Feedback
Zonka Feedback is an AI-powered Customer Feedback & Intelligence Platform that helps teams collect, organize, and analyze qualitative and quantitative data from every channel. It’s easy to set up and gives CX and product teams fast, structured insights without requiring deep technical expertise.
Zonka Feedback is best for customer experience, product, and operations teams in mid-sized businesses and enterprises that want unified feedback analysis, and automated workflows.
Pros:
- Supports omnichannel data collection including surveys, widgets, in-app, email, SMS, WhatsApp, and offline kiosks
- Response inbox with case management, alerts, and automated workflows
- Strong reporting with filters, drill-downs, CX metrics, and location/agent-level insights
- Integrations with CRMs, helpdesks, collaboration tools, and data platforms
Cons:
- Some users report occasional UI glitches or learning curve with deeper features
- Performance can slow down with very large datasets or extensive reporting
6. Dovetail
Dovetail is a qualitative research platform that focuses on collaboration and ease of use. It offers features like tagging, annotation, and collaborative analysis, making it ideal for teams working together on research projects.
Pros:
- Real-time collaboration features.
- Intuitive tagging and annotation UX.
- Seamless integration with other tools like Slack and Microsoft Teams.
Cons:
- Lacks AI-driven coding capabilities
- May lack some advanced analysis features found in other software.
- Pricing can be a consideration for smaller teams or individual users.
Manual vs. Software-Based Analysis
When it comes to qualitative data analysis, you have two primary approaches: manual and software-based. Each has its advantages and considerations.
Manual Analysis
Pros:
- Deep engagement with the data, fostering a thorough understanding.
- Flexibility to adapt analysis methods as insights emerge.
- No need for specialized software or technical skills.
Cons:
- Time-consuming, especially with large datasets.
- Higher risk of human error in coding and theme identification.
- Challenging to manage and organize extensive data manually.
Software-Based Analysis
Pros:
- Efficiently handles large volumes of data.
- Offers advanced tools for coding, visualization, and querying.
- Enhances consistency and accuracy in analysis.
Cons:
- Learning curve associated with mastering the software.
- Costs for licenses or subscriptions.
In summary, while manual analysis allows for a personal and flexible approach, it can be labor-intensive and impractical for large datasets.
Software-based verbatim analysis offers efficiency and advanced capabilities but requires an investment in time and resources to learn and implement effectively.
Choosing the right approach depends on your project’s scope, your familiarity with analytical tools, and your specific research objectives. If you’re interested in exploring the 10 best AI market research tools, click here.
Conclusion: Turning Qualitative Data into Actionable Insights
Qualitative data analysis is more than just identifying patterns—it’s about understanding the deeper stories behind the data.
From uncovering customer pain points to shaping impactful business strategies, QDA helps you make informed, human-centered decisions that numbers alone can’t provide.
With advancements in AI and qualitative research tools, analyzing open-ended feedback, interviews, and social media conversations has never been easier.
Tools like Blix allow you to streamline your workflow, save time, and extract insights faster and more effectively.
At Blix, we’re committed to helping researchers, businesses, and product teams simplify qualitative analysis so they can focus on what truly matters—turning insights into action.
Ready to see how Blix can help you unlock powerful qualitative data insights?


