Your market research team just launched a survey and collected 5,000 responses overnight. Buried in the comments are the reasons customers buy from a brand (and why some leave). But how do you make sense of it all? Manually reading and coding large datasets can take up a lot of your time.
In this article, we’ll show you exactly how to turn open-text responses into quantitative data that drives decision-making, comparing both manual and AI-powered methods.
Understanding Open-Ended Survey Questions in Market Research
Open-ended survey questions allow you to gather unique and varied responses that reveal why a product or service matters to customers. Unlike multiple-choice questions, which limit answers to rigid options, open-ended responses provide broader insights that can inform stronger decisions. For instance, asking “What do you like most about our product?” will deliver far richer feedback than a simple yes/no question or one with preset choices.
Advantages of Open-Ended Responses
Open-ended survey questions offer several advantages for market research:
- Capture the authentic customer voice: With no preset options, you can identify the tone, emotions, and language customers use, helping you to better understand a company’s target audience and align products with their needs.
- Surface unanticipated themes: Customers may highlight uses, frustrations, or benefits you hadn’t considered, revealing insights that can shape product or service development.
- Support hypothesis generation: Patterns in responses can spark new ideas or explanations. For example, if many mention issues around choosing the size of an item, a company might test whether unclear product details reduce conversions.
- Reveal the “why” behind loyalty: Open responses uncover the reasons customers stay, such as fast support or valuable features, which guide better business decisions.
Challenges of Analyzing Open-Text
Analyzing open-text survey data comes with several challenges:
- Time intensity: Manual coding can take days or even weeks to categorize responses, especially with large datasets.
- Risk of inconsistencies: Human coding is subjective, and some AI systems require oversight to maintain accuracy and avoid inconsistent results.
- Language complexity: Customers use varied wording, slang, and tone, which older or less advanced software may struggle to interpret correctly.
Manual Coding
Here are some of the main steps involved in manual coding of open-ended survey responses:
- Data cleaning: Remove duplicates or errors so your dataset is accurate.
- Reading responses: Go through each response to identify underlying patterns or repeated ideas.
- Creating a coding framework: Build a list of categories such as Customer Service or Pricing, and then allocate each response to one of those categories.
- Counting frequencies: Quantify how often each category appears. For instance, if 156 out of 600 responses mention delivery issues, you’ll know this is a top concern.
There are a few different ways to approach manual coding. Some teams rely on researchers to read and code every response by hand. Others may experiment with general tools, like ChatGPT, to speed up parts of the process. And a common approach is to use Excel, which adds structure and some automation to the manual process.
Using Excel
With Excel, you can:
- Set up columns: Add Response Text and Category columns to organize data.
- Assign categories: Label each response under the right theme.
- Filter categories: Review all responses in the same category for consistency.
- Count with a pivot table: Insert a pivot table to see how many responses fall under each theme.
Limitations of Manual Coding at Scale
Manual coding of open-ended survey responses has several limitations that can slow down projects and weaken results.
- Time-consuming: Manually reviewing and coding thousands of responses can take up much of your staff’s time. That time could instead be spent on higher-value activities such as implementing business decisions, developing products, or supporting customers. Reducing the hours spent on manual coding can help your business move forward faster.
- Difficulty updating codes: As you analyze responses, new themes or issues often appear. You might discover a recurring complaint about a mobile app feature midway through coding. Manually, you would need to create a new category, then go back through all of the responses to recheck which ones fit—a process that is both tedious and error-prone.
- Overwhelming workload: If you’re faced with 10,000 or more responses, the sheer volume can quickly lead to mental fatigue and burnout. For companies that regularly collect feedback, manual coding is not sustainable long-term, as teams will struggle to keep up with analyzing multiple surveys without mistakes.
Lack of accuracy: Human judgment varies, which makes consistency difficult. For example, if customers say “the instructions weren’t clear,” one coder might label it under User Experience while another places it under Customer Support. These differences make it harder to fully trust the final analysis.
AI-Powered Coding for Open-Ended Responses
AI-powered coding uses artificial intelligence to automatically read and categorize open-ended survey responses. Instead of manually assigning categories to each answer, the software analyzes language patterns and groups similar responses together.
If 400 customers mention pricing concerns in different ways—such as “too expensive,” “not worth the cost,” or “prices are too high”—the AI can recognize the similarity and group them under a single theme like Pricing Issues.
How AI-Powered Coding Works
AI-powered coding has evolved through different models over the years. Natural Language Processing (NLP) was one of the earlier approaches, relying heavily on keyword matching and simple text rules. While this worked for very basic tasks, it often missed the nuances in customer responses. For example, if one customer wrote “shipping was delayed” and another wrote “my package didn’t arrive on time,” an NLP system might treat those as unrelated simply because the exact words don’t match.
Another approach is machine learning models, which could be trained to spot patterns and classify responses into themes. However, they require large amounts of pre-labeled data and ongoing adjustments to stay accurate. As a result, they often produce rigid outputs and struggle to adapt when unexpected themes appear in the data.
Today, large language models (LLMs)—like those built by OpenAI, Claude, and Google—power software solutions such as Blix, which takes a far more advanced approach to analyzing open responses by focusing on semantics rather than keywords. These systems interpret the actual meaning behind responses, much closer to how humans understand language.
For instance, if one person says “the website was easy to navigate” and another writes “the online interface was user-friendly,” an LLM recognizes both as the same positive sentiment. It can even account for spelling mistakes, emojis, and different languages, since the underlying meaning stays consistent. This meaning-based coding allows for more accurate and flexible categorization. Entire datasets can now be processed in minutes, turning thousands of open-text responses into quantifiable insights.
Advantages for Market Researchers
AI-powered coding offers several advantages that save time, improve accuracy, and make survey analysis more flexible.
- Speed and scalability: With an AI-powered tool, the work of an entire team can be completed in just minutes. Instead of having multiple staff manually code thousands of responses, one person can upload the data and let the software handle it automatically, freeing up hours of valuable time.
- Consistency across the dataset: AI applies the same rules across all responses, ensuring that similar comments are grouped the same way. Unlike human coders, who may interpret responses differently, AI keeps the results consistent and reliable.
- Sentiment analysis: AI can instantly detect positive, negative, or neutral sentiment behind responses to make sure important tones and emotions aren’t overlooked. For example, two customers might both mention delivery: one says “delivery was fast and reliable” (positive), while another says “delivery took too long” (negative). Grouping both simply under Delivery misses the underlying sentiment.
- Revising themes: Even after coding is complete, AI-powered analysis tools let you remove, split, or merge categories. This flexibility makes it easy to refine themes as new insights emerge.
- Exporting results: Once the analysis is done, you can export findings to Excel for deeper exploration or to PowerPoint for polished charts and ready-to-use presentation slides.

How AI Makes Quantitative Analysis Possible
With open-ended responses, the language is often unstructured because every customer phrases comments differently. AI can scan through this text, identify common ideas, and organize them into categories, turning scattered comments into structured information.
Once responses are grouped, AI-powered tools can create numeric patterns from the text. To illustrate, if hundreds of guests mention a hotel’s cleanliness or service quality in reviews, the system can calculate what percentage of reviewers raised those concerns. You might find that 45% of respondents brought up cleanliness—a clear data point you can compare against other metrics, such as customer satisfaction or repeat bookings.
This approach also makes it possible to track changes over time. For instance, if the hotel launches a new guest experience program, you might see positive mentions of service quality rise from 20% in one quarter to 40% in the next.
AI also makes it easy to present results visually. Structured data can be turned into:
- Bar charts for comparing top issues
- Heat maps or dashboards for identifying trends at a glance
These visualizations make complex feedback simple to understand and share with decision-makers.
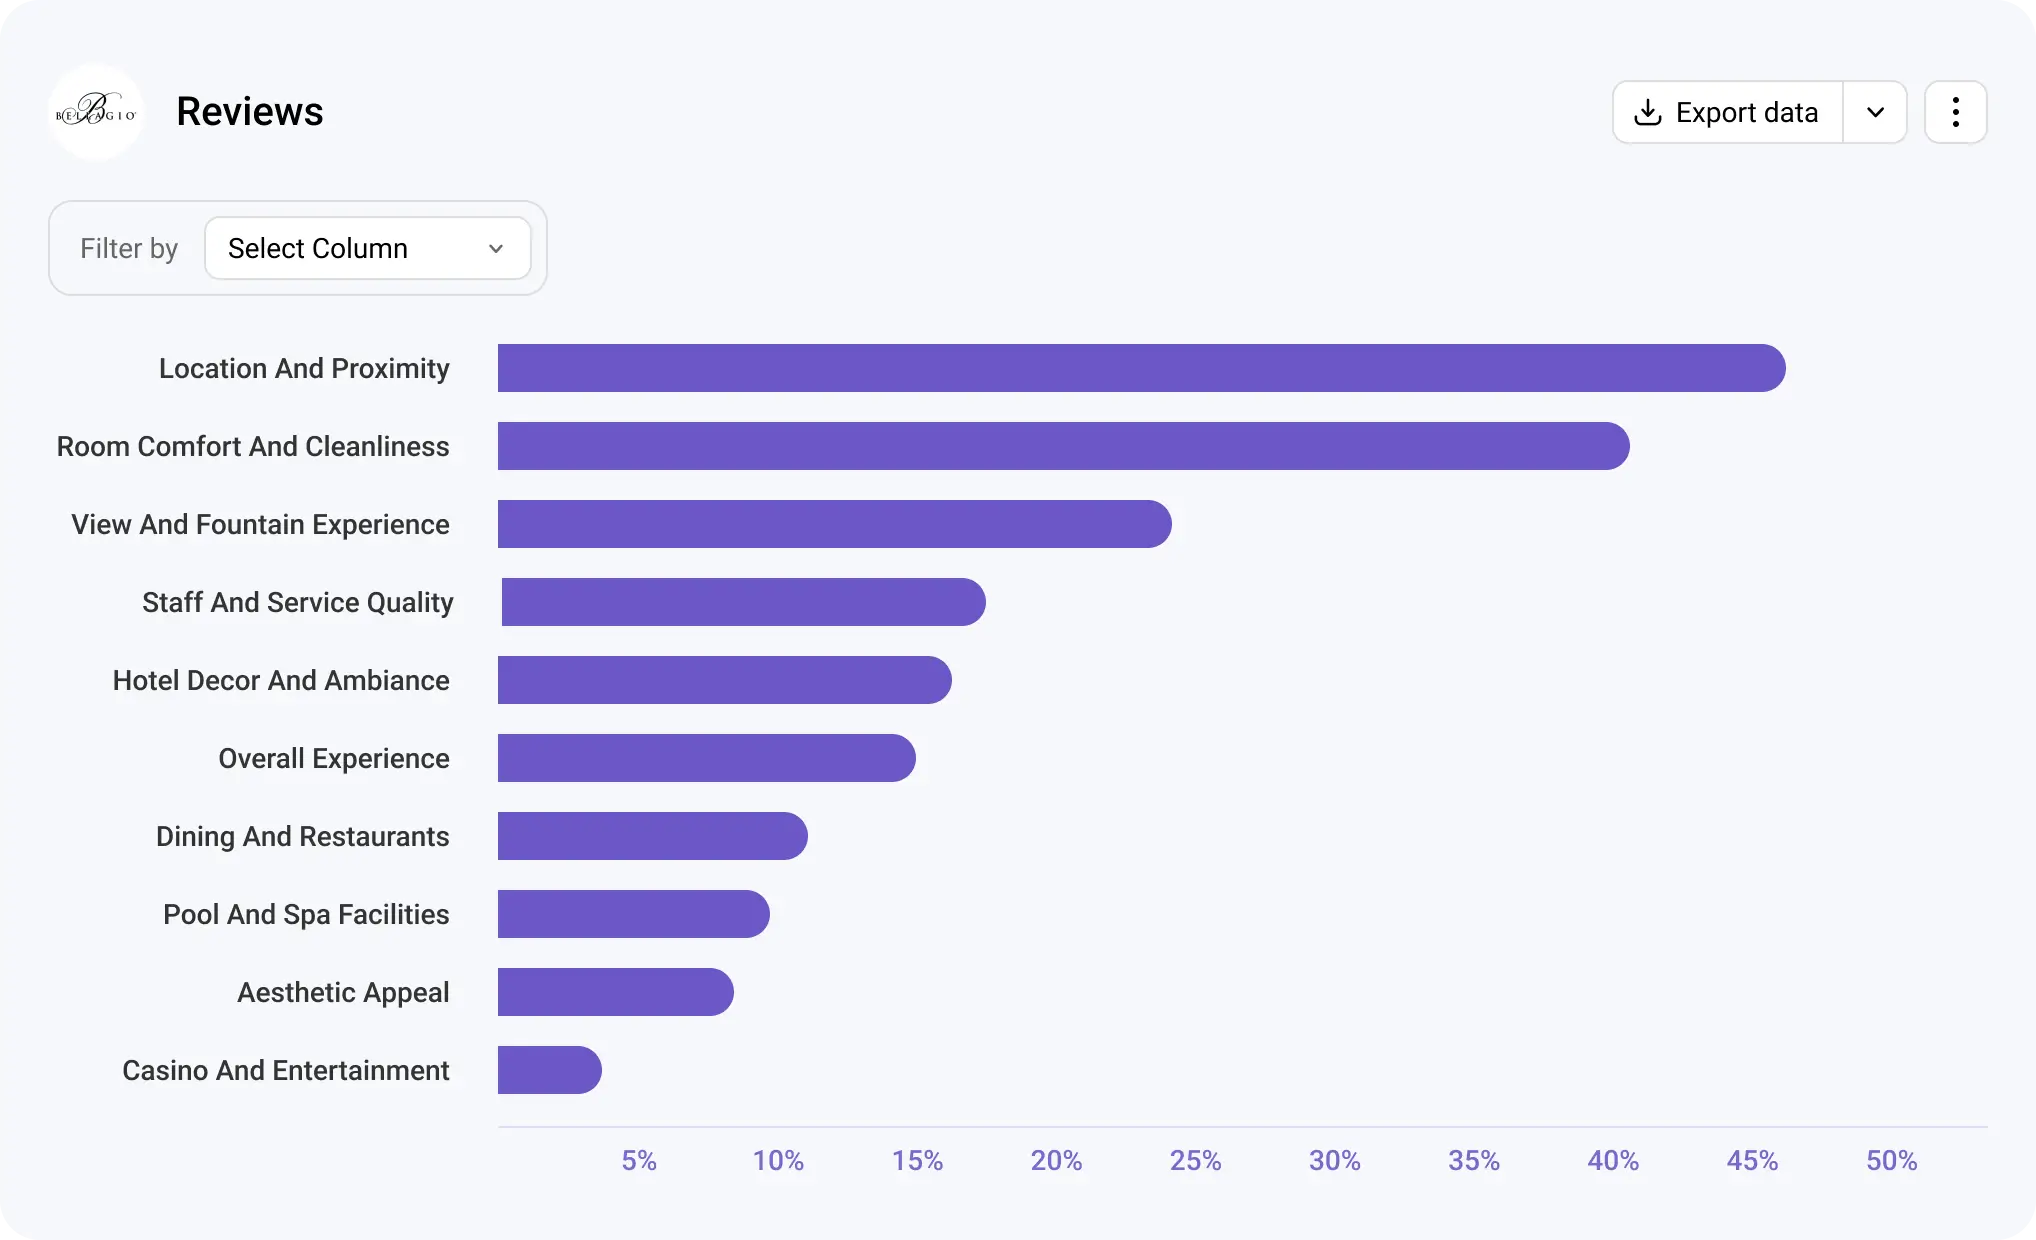
The bar chart below has been generated using Blix. It shows how guest comments about the Bellagio Hotel were categorized and quantified. Each bar represents a theme pulled from hotel reviews—such as service quality or room comfort—while the percentages along the bottom indicate how often each theme appeared. Blix’s AI-powered tool turns open-ended feedback into measurable data.
How Blix’s AI Tool Powers Scalable Open-Ended Analysis
Blix transforms open-ended survey responses into clear, quantified insights that researchers can deliver to their clients in minutes, supporting faster, data-driven decision making.
The Blix Advantage
Blix has redefined AI-powered analysis for open-ended survey responses. Here are some of the key benefits it offers:
- Built for researchers: Market researchers often collect data on a large scale, and Blix is designed specifically to handle it. The platform can process thousands of open-ended responses at once.
- Human-level coding: Unlike older models that rely on keyword matching, Blix interprets the meaning and sentiment behind responses. For instance, it understands that “checkout was complicated” and “the online cart was hard to use” both reflect the same issue in the purchase process.
- Quick and efficient: Instead of a team of three spending 80 hours manually coding responses, a single researcher can run the data through Blix and deliver actionable insights the same day. This efficiency gives teams more time to focus on strategy and solutions.
- Intuitive and easy to use: With a clean, user-friendly interface, Blix makes it easy to upload data, code responses, and review results. Even researchers without technical skills can navigate the platform without IT support.
- Flexible theme creation: Blix allows you to add, split, or merge categories on the fly. If a new theme emerges mid-project, you can adjust the framework without redoing the entire analysis.
- Supports multiple languages: Blix codes responses across many languages, making it ideal for global surveys. Reports can also be exported in the language needed for local teams.
Workflow Inside Blix
Here’s how Blix processes open-ended survey responses:
- Import open response data: Save your raw responses in a spreadsheet and upload them directly to Blix. This process eliminates the need for copying and pasting large amounts of text.
- AI suggests initial themes: Once the content is uploaded, Blix automatically scans the responses and groups them into themes, saving hours of manual reading and coding.
- Review and adjust themes: Each theme is displayed in an organized list, with options to review, refine, or reorganize as needed. You can merge similar themes or create entirely new ones without restarting the process.
- Export quantitative data: After finalizing themes, Blix converts the feedback into quantitative data. You’ll see exactly how many responses fall into each category, along with a brief explanation of each theme. You can then export results into Excel for deeper analysis or PowerPoint for clear visualizations.
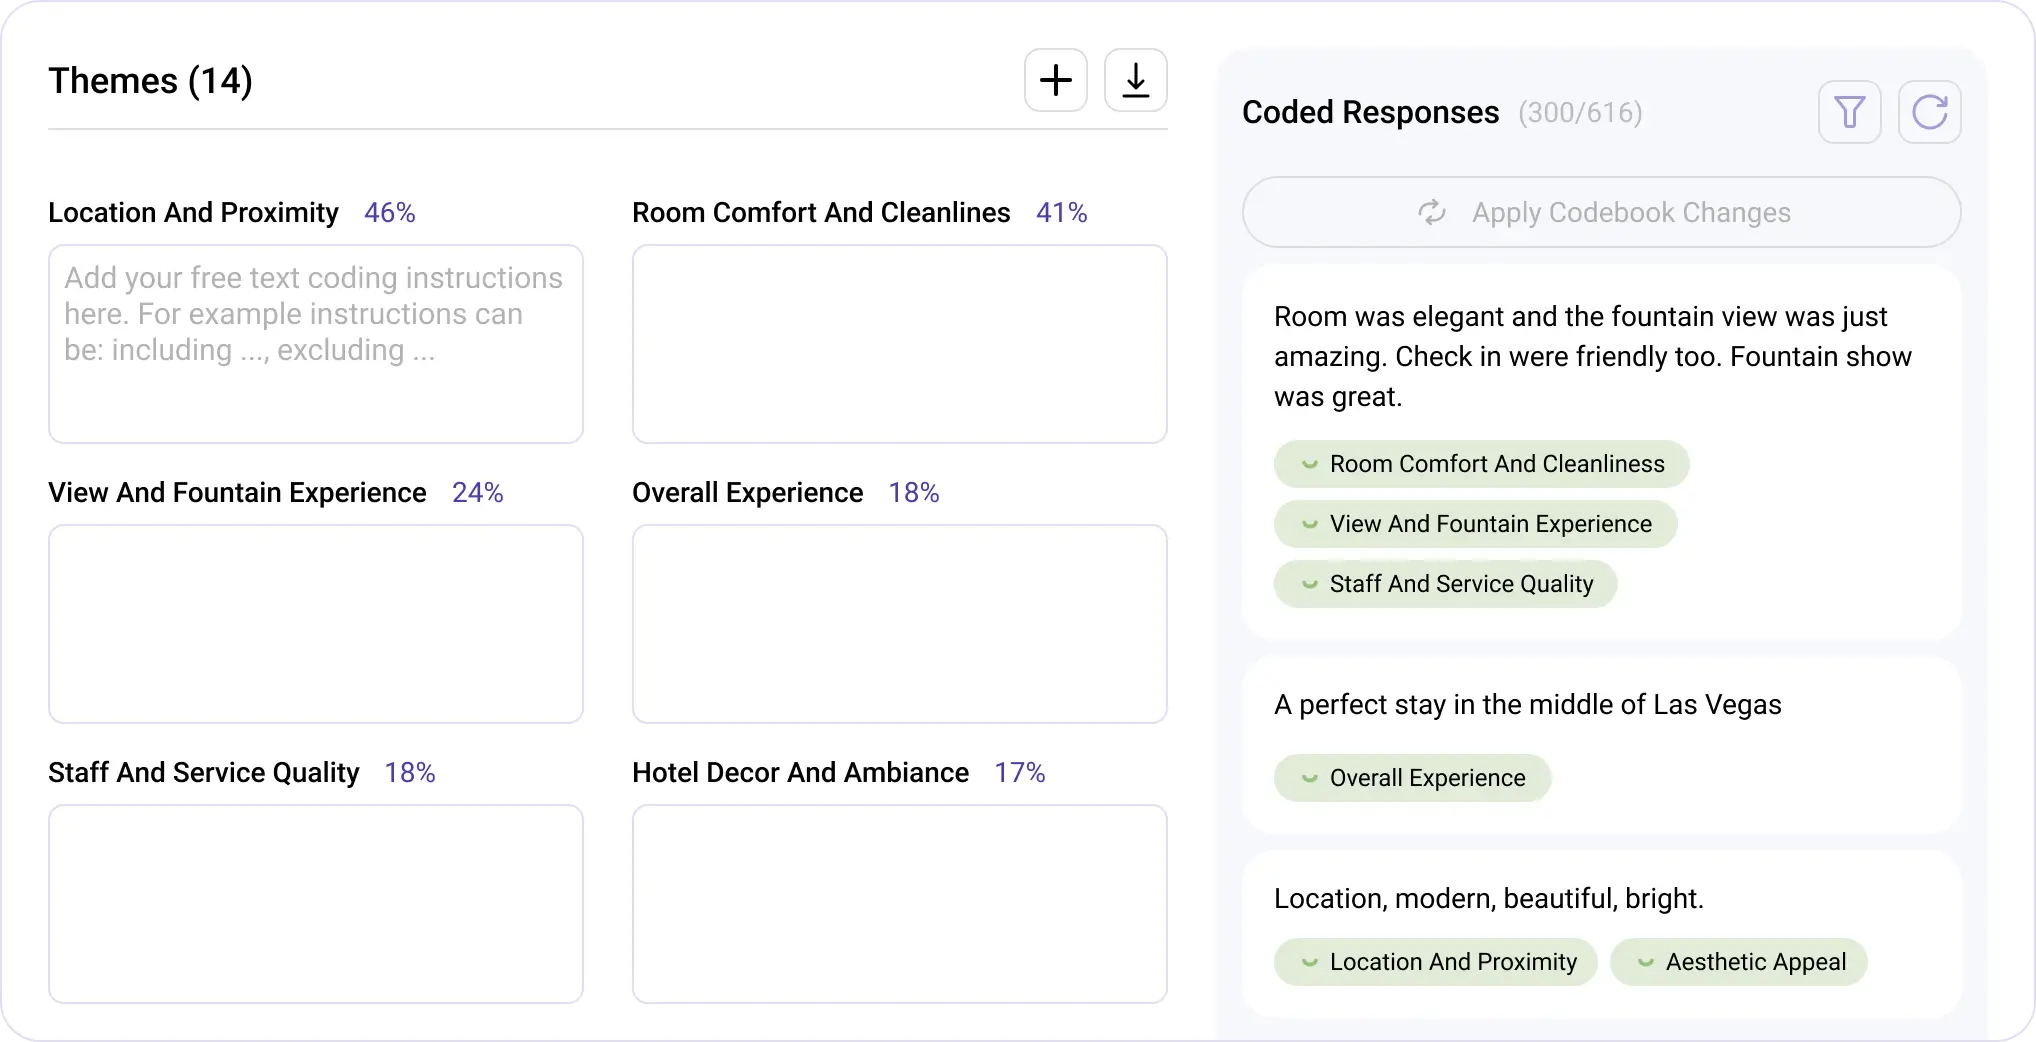
This image shows themes generated from Bellagio Hotel reviews after importing open-ended review comments into Blix. Users can edit themes and add coding instructions to include or exclude specific topics for more precise analysis.
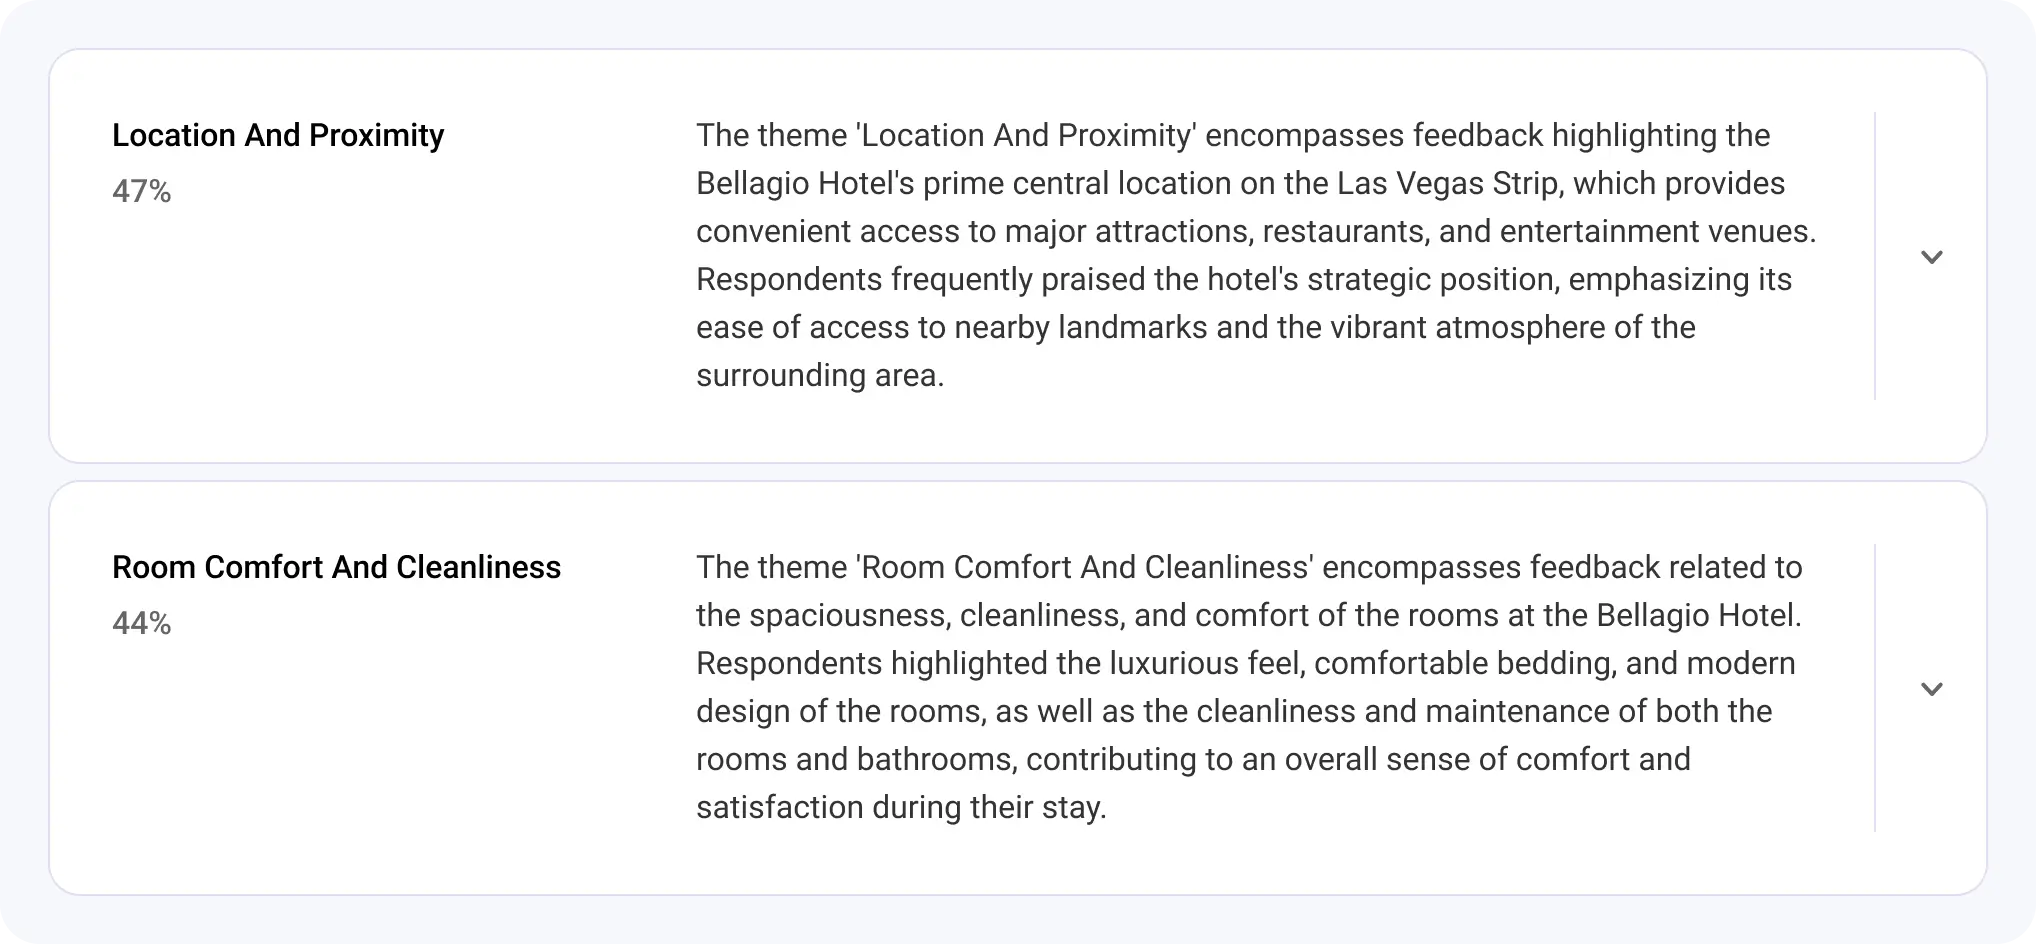
The image below highlights two themes from Bellagio Hotel reviews: Location and Proximity, which reflects feedback on the hotel’s central spot and easy access to attractions, and Room Comfort and Cleanliness, capturing comments about the quality and upkeep of guest rooms.
Blix in Action
Generosity X, a nonprofit consultancy that partners with charities to grow annual giving, needed to analyze large-scale open-ended survey responses to better understand their donor base and the motivations behind fundraising intentions. To meet this challenge, they adopted Blix, which reviewed and analyzed responses in just minutes. Using Blix’s AI tool resulted in:
- 5x faster results: Blix delivered insights five times quicker than manual or outsourced methods.
- 82% less manual work: The team dramatically reduced time spent coding, freeing them to focus on higher-value tasks like strategy and campaign design.
With these efficiencies, Generosity X was able to use Blix’s insights to design more engaging, personalized, and impactful donor campaigns—creating stronger connections with their audience while saving hours of work. Read the full case study here.
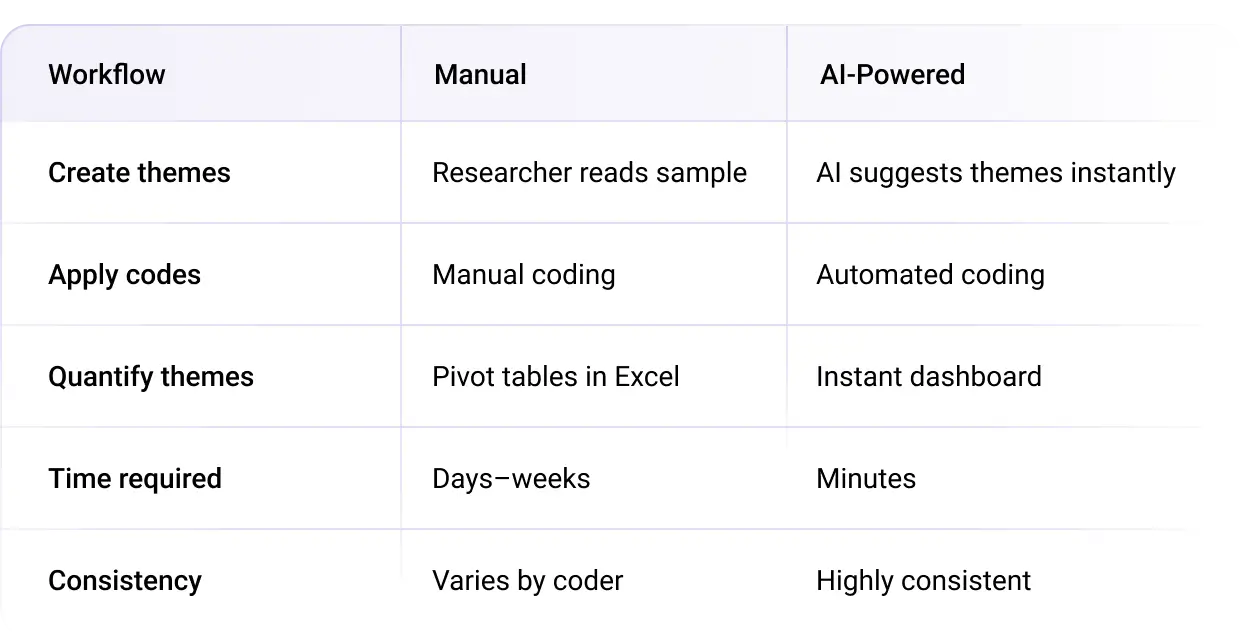
Step-by-Step Comparison: Manual vs. AI-Powered Coding
Moving from Data to Decisions
You can capture better insights with large-scale surveys, gathering more of your customers’ voices and motivations. And the best part? It doesn’t mean you have to spend more time analyzing. With Blix, you can do it faster and more accurately.
Here’s a quick recap of the different ways to code open-ended survey questions:
- Manual coding: The traditional method of reading each response and coding it under categories. It works, but it’s slow, inconsistent, and nearly impossible to scale when you have thousands of responses.
- AI-powered coding: A faster option that uses artificial intelligence to turn unstructured text into themes and counts. It saves time and improves consistency, but not all tools handle nuance well.
- Blix: A next-generation platform built for market researchers. It goes beyond keyword analysis, using semantic coding to interpret meaning like a human would—delivering insights in minutes, not weeks.
Don’t let valuable insights get buried in spreadsheets. With Blix, you can transform messy, unstructured responses into clear, actionable data.
Book Your Blix Demo and discover how easy it is to turn open-ended feedback into measurable results that drive strategic decisions.
Curious to see Blix in action?
Start a free demo today and experience how quickly AI can turn open-ended survey responses into data you can deliver to your clients.


