You send a survey about your product or service and a flood of customer feedback comes in. With thousands of open-ended responses, how do market research or CX teams analyze it all? How do you figure out what your customers actually like, dislike, and care about most?
Cue thematic analysis. It's a process that takes open-ended survey responses and sorts them into themes, so you get a clear picture of what your customers are saying, and exactly what to do about it.
In this guide, we'll cover what thematic analysis is, how to do it step by step, and how AI is speeding up the process.
What Is Thematic Analysis?
Thematic analysis is the process of reading through open-ended survey responses and grouping them into themes. Instead of reading every single response over and over again, you end up with a short list of themes that summarize exactly what your customers are thinking.
For example, in a post-purchase survey with 1000 responses, customers might write comments like: “Too many steps”, “I couldn’t find where to enter my promo code”, “I wasn’t sure if my order went through”. Thematic analysis might group these different comments under a theme like “Confusing checkout.”
Instead of reading every response one by one, you can quickly see the pattern, understand what is causing friction, and quantify it - for example: 35% of responses mention payment issues, 25% mention promo code confusion, and 20% mention too many steps.
Thematic Analysis for Open-Ended Survey Responses: How It Differs from Qualitative Research
Thematic analysis is used in both qualitative research and open-ended survey analysis, but the work is not exactly the same.
In traditional qualitative research, such as in-depth interviews and focus groups, the goal is usually to understand meaning in depth. Researchers work with long transcripts, read responses in context, and often code specific passages line by line. The focus is on nuance, interpretation, and understanding why people think or behave a certain way.
Open-ended survey responses are different. They are usually shorter, more direct, and collected at a much larger scale. A respondent might write one sentence, a few words, or a short paragraph.
The goal is less about interpreting a full conversation and more about identifying and quantifying recurring patterns across hundreds or thousands of responses.
This is why thematic analysis for surveys sits between qualitative and quantitative research. The input is qualitative because people answer in their own words but the output is structured quantitative data.While traditional qualitative research uses thematic analysis to deeply interpret meaning, and uncover feelings, emotions and motivations, open-ended survey analysis uses thematic analysis to structure and quantify feedback at scale so you can use open ended feedback in statistical analysis, BI dashboards, and data-based decision making.
Stop guessing and find out what your customers are really saying with thematic analysis
How To Run Thematic Analysis on Your Survey Responses
Most thematic analysis frameworks are inspired by Braun and Clarke’s step-by-step process.
The main steps follow this overall process: first you build your codebook by identifying themes, then you code your data by applying those themes to your responses, then you review and report your findings.
Here is a breakdown of the main steps:
Step 1: Familiarize Yourself With the Data
Before you start coding, read through your survey responses. This step is where you start noticing patterns, like phrases that keep coming up, frustrations that feel widespread, or comments that surprise you.
As you read, take notes. Flag recurring language and emotional responses. You're not analyzing yet, just getting a feel for what's in the data.
For example, if you're reviewing responses from a boutique hotel survey, you might notice guests repeatedly mentioning "beautiful design," "long check-in," "noise," and "not worth the price." Nothing is coded yet, but you're already starting to see the shape of the story.
Step 2: Identify Themes
Once you've read through the data, start identifying the recurring themes. A theme is a pattern that keeps showing up across multiple responses.
For example, a guest comment like "We waited almost an hour to check in" might be grouped under a theme like "Service Delays," while "The rooftop bar had an amazing atmosphere" falls under "Positive Hotel Atmosphere."
Skip the manual grouping. Let Blix handle thematic analysis automatically
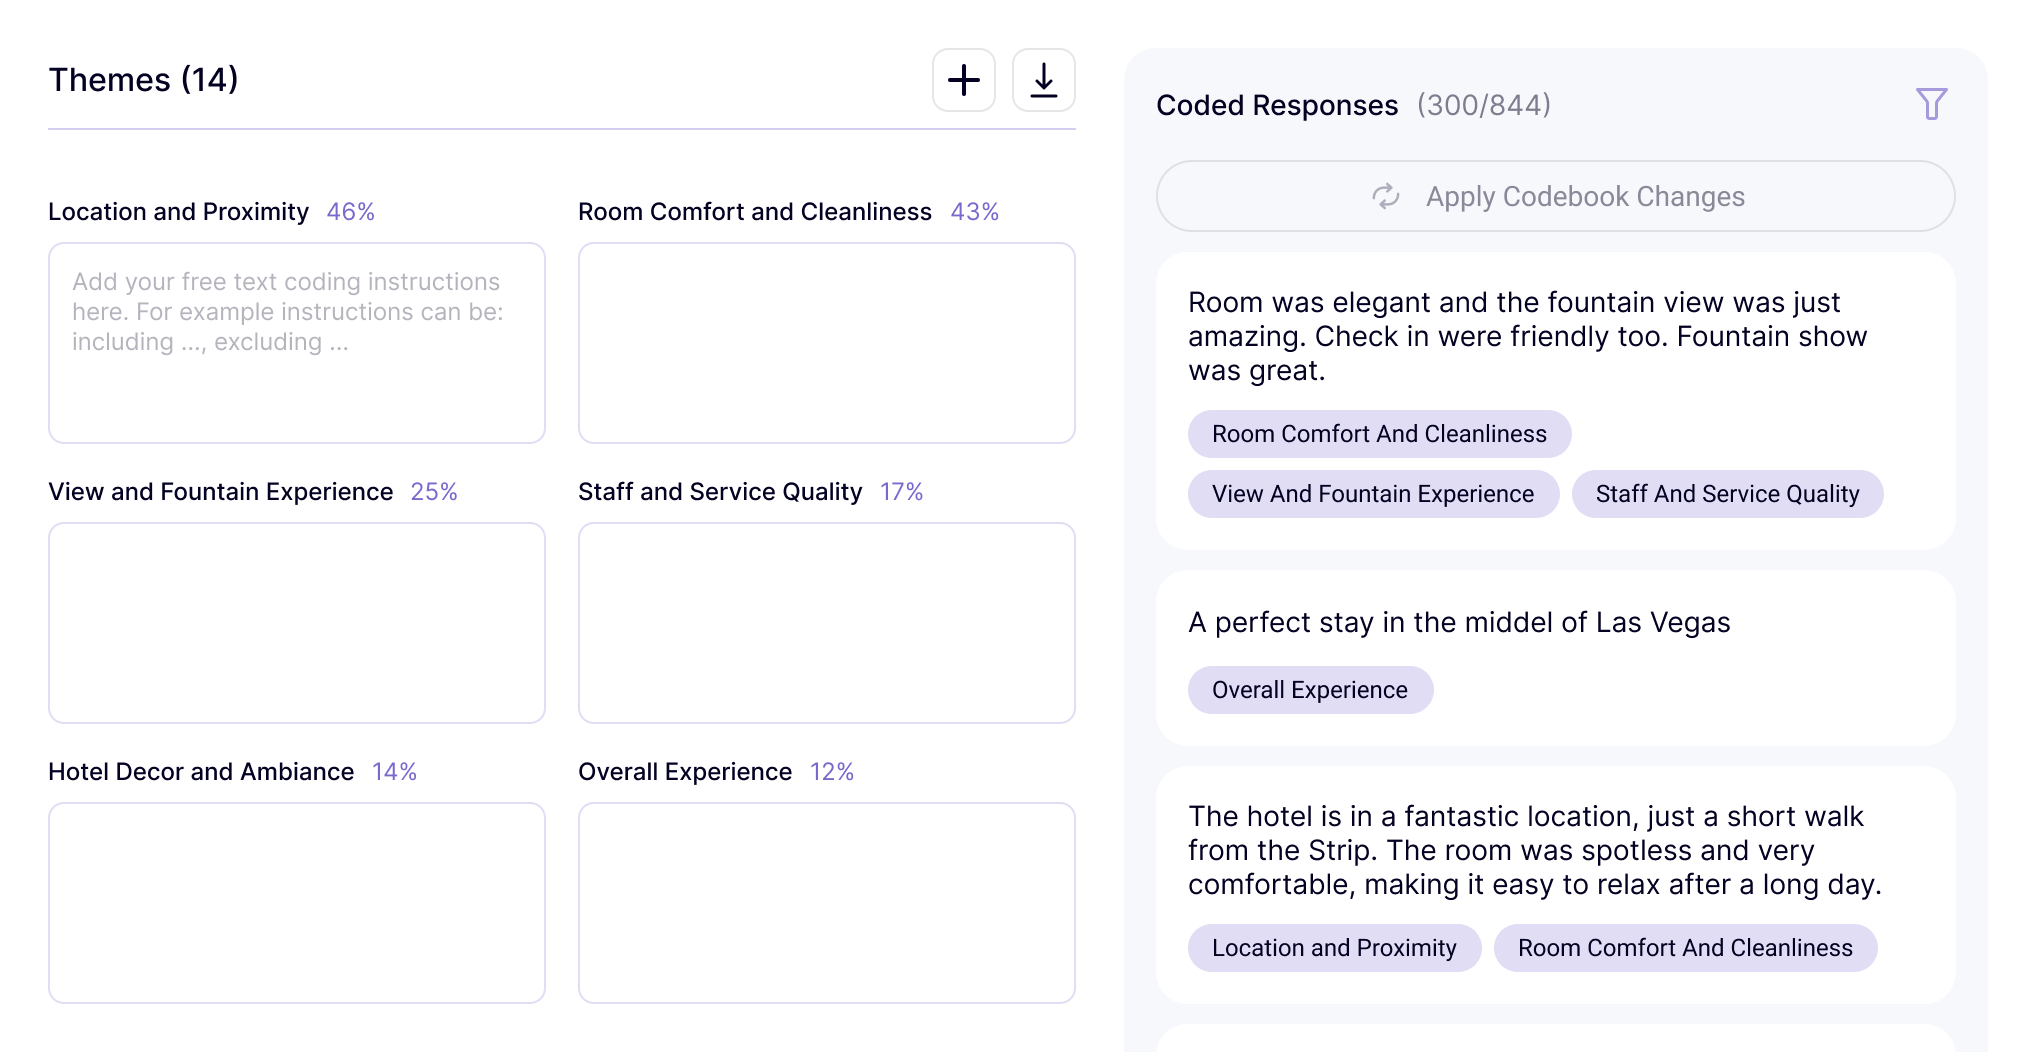
Step 3: Code Your Data
With your codebook ready, go back through the responses and assign a code to each one. For example, "We waited almost an hour to check in" gets the code "long wait time." "The room was filthy" gets the code "cleanliness issue."
As you code, you might decide a new code needs to be added. That's fine, but you'll then need to go back and recode everything from the beginning with your updated codebook.
Step 4: Present Findings and Insights
Themes are only useful if your team can act on them. That might look like a summary report, a dashboard, a slide deck, or even a simple document with key themes and supporting quotes.
Common Mistakes in Thematic Analysis
There are a few pitfalls to keep in mind that can skew your findings during thematic analysis:
- Themes that are too broad or too narrow: A theme like "Customer Experience" covers too much to be useful. But having many micro-themes isn’t great either. You'll get lost and miss the real insight. Good themes are specific enough to mean something and broad enough to tell a story.
- Cherry-picking quotes: It's easy to pull responses that support what you already believe. A good analysis looks at everything, including the responses that challenge your assumptions.
- Misalignment between your data, research questions, and themes: Thematic analysis should serve a purpose. If your research questions, data or themes don't connect back to what you were trying to find out, the analysis will not be useful no matter how clean it looks. Always keep the research question in mind.
Can ChatGPT Do a Thematic Analysis?
Yes, ChatGPT and Claude can be very helpful tools for thematic analysis, especially when you are trying to get a quick sense of what people are saying.
If you are working with a small dataset, doing early exploration, or trying to quickly understand the main topics in a set of responses, ChatGPT or Claude can be genuinely helpful. It can save you lots of time compared with reading everything manually from scratch.
But using ChatGPT as your primary thematic analysis tool also comes with important limitations.
As an example, let's run a thematic analysis using ChatGPT. The dataset we're using contains reviews for a hotel, and the goal is to identify the major themes across all responses so we can understand what guests liked, disliked, and cared about most.
When we upload the file and ask ChatGPT to run a thematic analysis, here are the results:
As you can see, ChatGPT produces a fluent, readable explanation. The output is easy to understand and can be useful as a first-pass summary. In total, the five themes it identified were:
- Prime Location & Walkability
- Comfortable, Spacious Rooms
- Iconic Views and Fountain Experience
- Luxury Atmosphere and Amenities
- Friendly and Professional Staff
At first glance, this looks helpful. The themes make sense, and they give us a reasonable overview of what guests are talking about.
Though the output is still mostly a narrative report. While the themes are listed, there’s no percentages, and no way to tell at a glance which issues came up most. It reads like an essay. You'd still have to manually dig through it to pull out anything actionable. And with 640 reviews, there's no guarantee it even processed all of them.
"Staff & Service" and "Views & Fountains" look equally important in this table, but are they really? You have no idea.
Now, you can ask ChatGPT to add numbers to the table, and it will. But there's no way to verify them or trace them back to the actual responses.
With these insights, though, ChatGPT works well for:
- Students and researchers on a budget
- Early-stage exploration
- Small datasets
But ultimately, there are limitations to using ChatGPT for thematic analysis, including:
- Accuracy issues: ChatGPT doesn't analyze your data systematically. It reads what you paste in and generates a response, which means themes can be inconsistent, missed, or just plain wrong.
- It can’t quantify accurately: It might show you numbers, but they're not reliable. You can't trust a percentage that wasn't calculated from your actual dataset.
- Data volume limits: You can only paste so much text into a single prompt. If you're working with hundreds or thousands of survey responses, ChatGPT may not process your full dataset at once.
- Hallucinations: ChatGPT can confidently present themes or insights that aren't actually supported by your data. When accuracy matters, that's a serious problem.
- Not built for structured analysis: ChatGPT is a general-purpose tool. It wasn't designed for professional quantitative research. It gives you text outputs, but for your actual workflow you need structured data that you can slice by cohorts, analyze with the rest of your survey data in R, Excel or SPSS, or load directly into your BI tool.
- Not private: Any data you upload to ChatGPT may be used to train future models, which could be a big issue for researchers (especially in regulated sectors like health or finance). Survey responses often contain sensitive feedback or proprietary business data that shouldn't leave your organization.
If you're a professional researcher, a dedicated tool fits directly into your workflow and gets you accurate, reliable results faster.
What AI-Powered Thematic Analysis Looks Like With Blix
Manually working through hundreds or thousands of open-ended responses could take days or weeks. Blix compresses the thematic analysis process into a few clicks, saving you hours and hours of manual work and frustration. Here's how it works.
Upload Your Data
Start by uploading your survey responses directly into Blix. It accepts Excel, CSV, or SPSS.
Generate Themes
Once your file is uploaded, Blix analyzes your responses and automatically surfaces recurring themes across your dataset. If a theme needs a better name, needs to be split, or doesn't quite fit, you can easily adjust it.
Generate Your Report
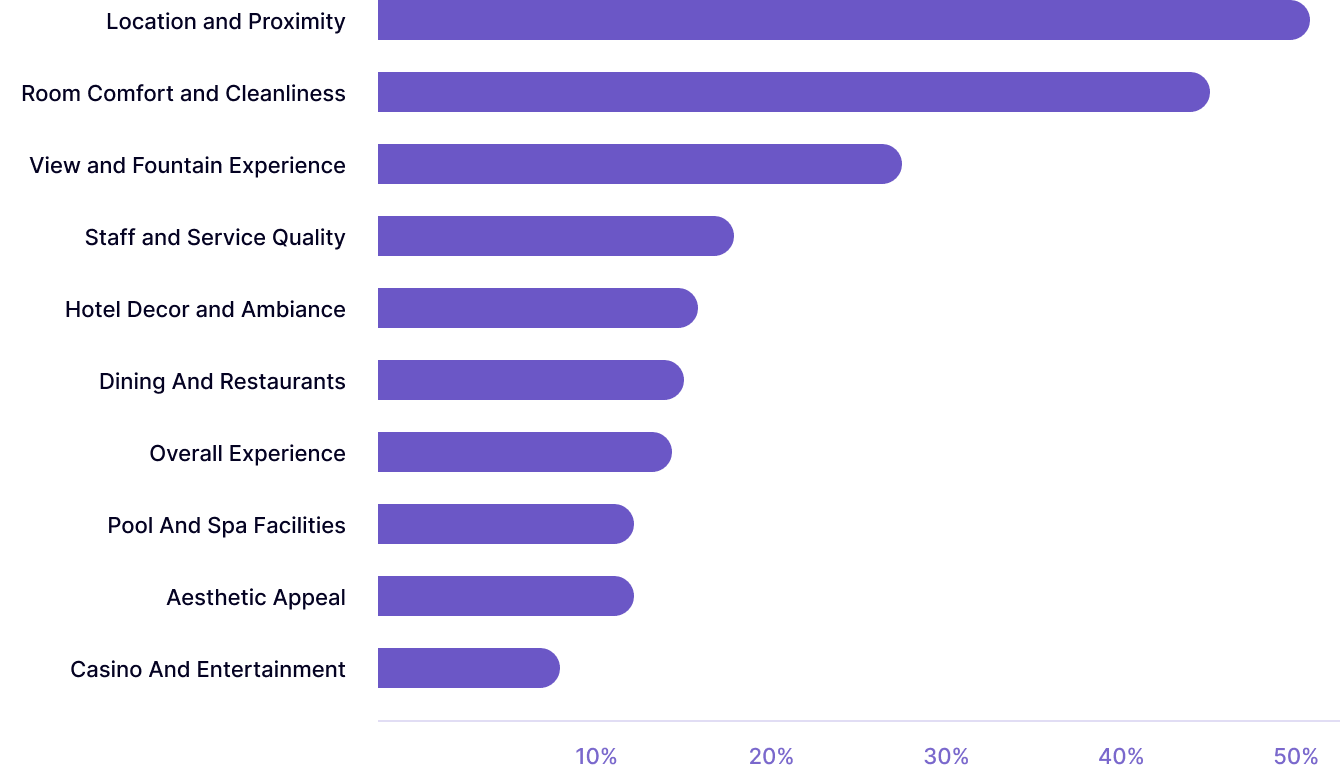
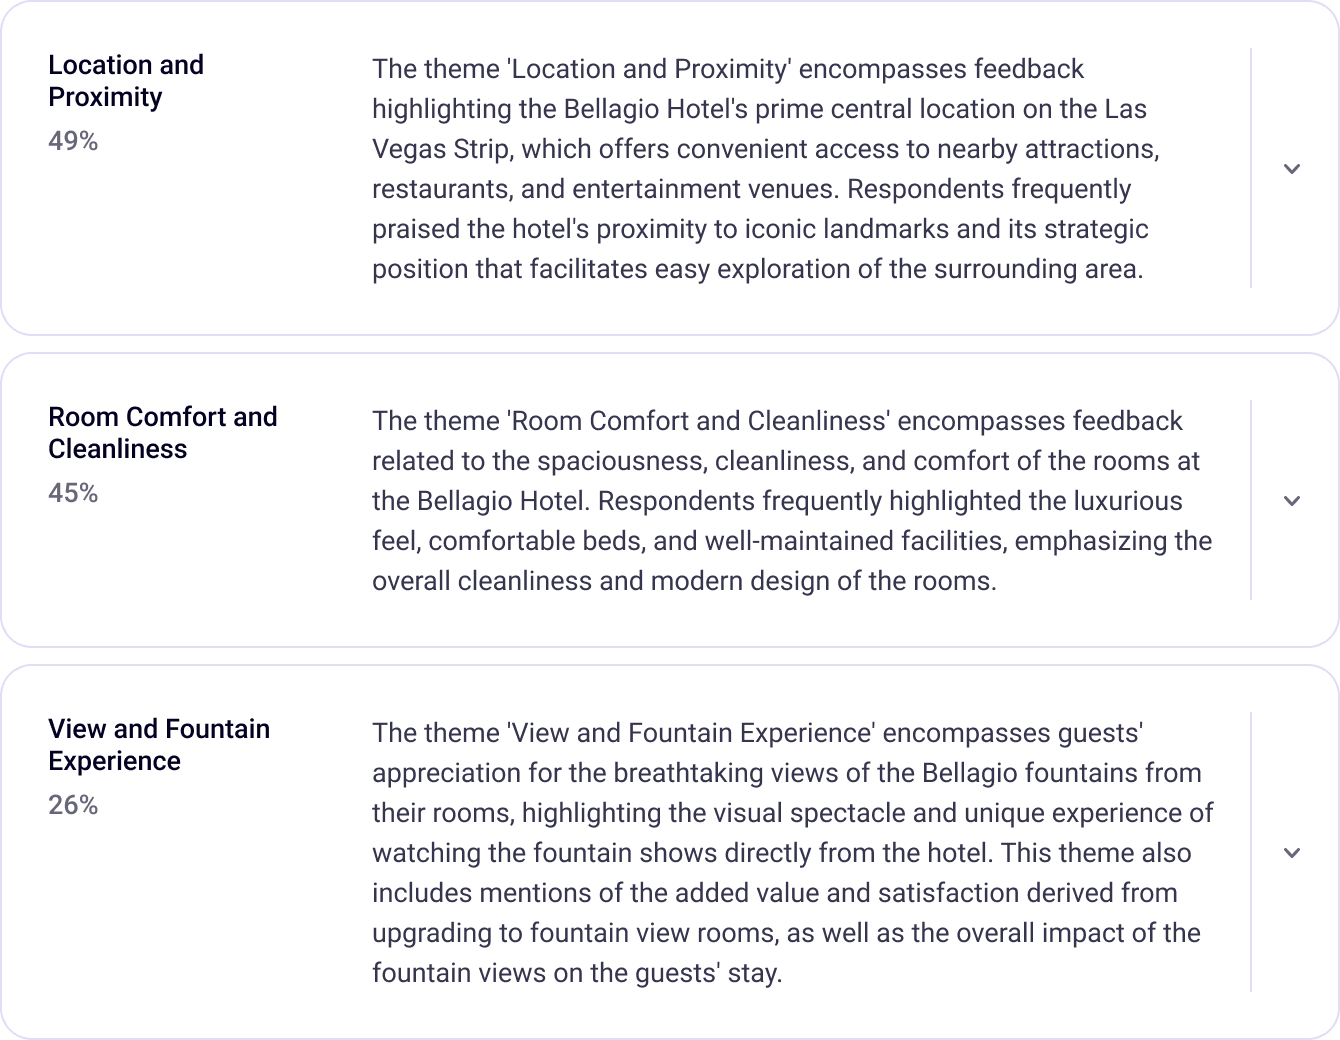
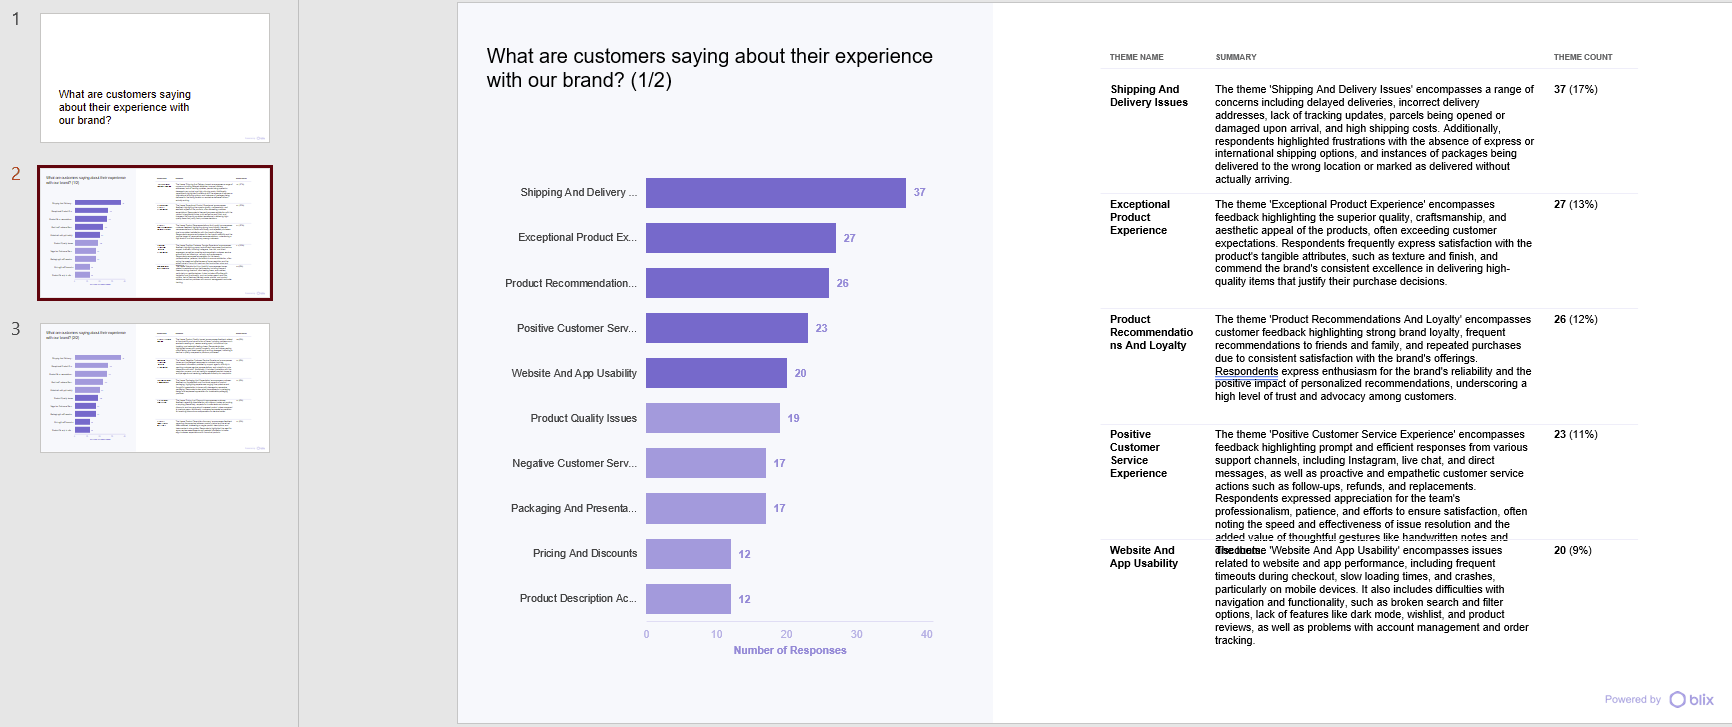
When your themes are ready, one click generates a full report. You get a visual summary with bar charts showing theme frequency and a written summary of your key findings describing each theme.
Export and Share
You can easily export your report as an excel file or PowerPoint presentation, ready to share with your team, your client, or your leadership.
Start Finding What Your Survey Data Is Really Saying
As a professional researcher, the goal is to spend less time and effort on thematic analysis so you can deliver faster turnarounds for your clients and free up more time for other important tasks. However, working with inaccurate tools like ChatGPT is frustrating, and doing it manually is time-consuming.
So if you're tired of running thematic analysis on open-ended responses manually, Blix fits easily into your existing workflow. With just a click, it analyzes your responses, identifies your themes, and generates a full report in minutes.
Your data has a story. Blix helps you tell it through quick & easy thematic analysis.


