Research teams collect open-ended feedback from customers through many types of surveys, including customer experience surveys, product feedback, and brand perception studies. Within these written responses are valuable signals about what people expect, what shapes their decisions, and where friction appears.
Your team may need to make sense of hundreds or even thousands of written responses collected across customer surveys. That’s exactly where qualitative survey analysis comes in. It helps research teams interpret open-ended responses to uncover recurring themes, customer motivations, and opportunities for better decision-making.
In this article, we’ll walk through the exact steps involved in qualitative survey analysis, along with the challenges and benefits to consider and how AI can help speed up the process.
What Is Qualitative Data Analysis?
Qualitative data analysis is the process of reviewing and interpreting non-numerical data such as text responses, interview transcripts, or written feedback. In surveys, this typically includes open-ended questions where respondents describe experiences, preferences, or concerns in their own words.
Let’s say a clothing brand sends out a post-purchase survey to better understand the online shopping experience. One of their open-ended questions asks, “What was the most frustrating part of your recent shopping experience?”
Customers might respond with comments like:
- “My order took longer than expected to arrive.”
- “The sizing guide didn’t match how the item actually fit.”
- “Checkout kept freezing when I tried to apply a discount code.”
- “I wasn’t sure what the return policy was until after I placed the order.”
Qualitative analysis groups these responses into shared themes, such as shipping delays, sizing issues, or unclear policies. Researchers analyze this feedback to identify patterns and shared sentiments across responses, helping explain the reasoning behind customer behavior, satisfaction levels, or product perceptions.
Want to understand the reasons behind your feedback? See how Blix makes qualitative data analysis quick & easy
Qualitative vs. Quantitative Data Analysis
Quantitative analysis focuses on numerical data such as ratings, rankings, or multiple-choice selections, while qualitative analysis focuses on written or spoken responses that provide context behind those numerical scores. When analyzing survey data, quantitative data shows what respondents chose, qualitative data helps explain why they made those choices.
For example, the clothing brand mentioned earlier might see that 38% of customers rated their checkout experience as a 3 out of 5. That number signals a problem, but it doesn’t explain what went wrong. Open-ended responses might reveal that shoppers were confused about how to apply promo codes or weren’t sure whether their order had gone through.
Together, quantitative and qualitative data provide a more complete picture of the customer experience by pairing measurable trends with the real-world context behind them.
Benefits of Qualitative Data Analysis
Qualitative analysis helps explain why customers behave the way they do and highlights issues that numbers alone can’t reveal. Using our clothing brand example, here’s what that can look like:
- Adds context to quantitative trends: If checkout satisfaction drops from 4.2 to 3.6, customer comments might reveal that the payment page was freezing.
- Reveals unmet customer needs: Open-ended responses can surface issues surveys didn’t directly ask about, such as clothing running small or materials feeling thinner than expected.
- Supports smarter product and UX decisions: When many customers mention the same problem, like confusion around return policies, teams know exactly what to improve.
- Understand customer sentiment: Instead of relying only on metrics like cart abandonment, teams can see the actual frustrations behind those behaviors.
In short, qualitative analysis turns written feedback into clear signals about what customers are experiencing.
Steps in Qualitative Survey Analysis
Using feedback from customers of the clothing brand as an example, here’s how teams can analyze open-ended survey responses in Excel to turn written comments into actionable insights:
1. Collect and organize responses: Start by collecting open-ended survey responses from customers and organizing them into a central dataset.
For example, after asking “What was the most frustrating part of your recent shopping experience?”, your Excel sheet might look something like this:
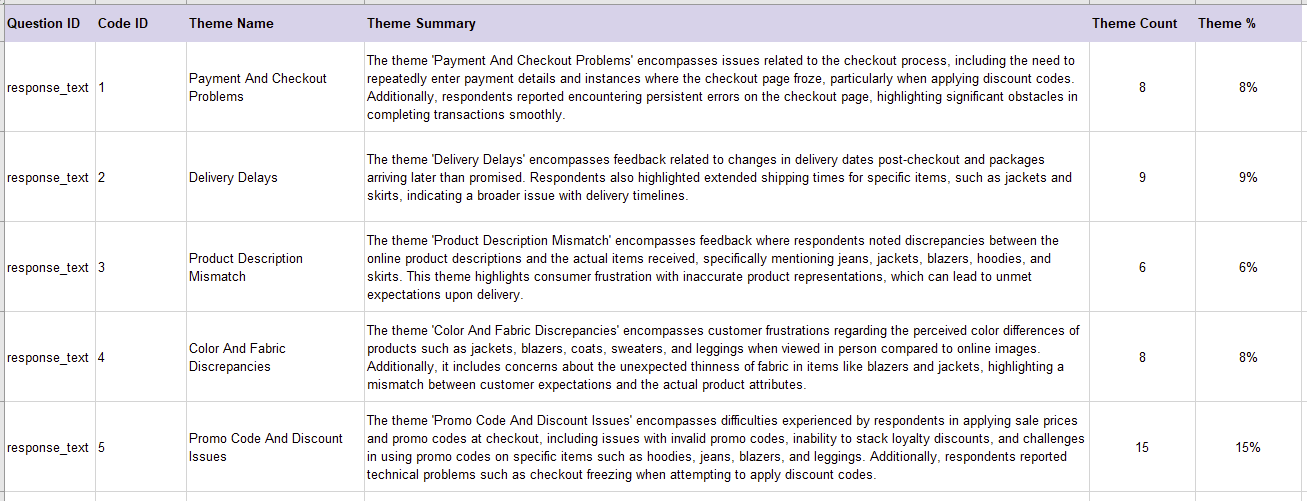
2. Code responses: Next, review each response and assign a short label (or “code”) based on the main issue mentioned.
3. Create a pivot table: After assigning themes, create a pivot table to count how often each theme appears across responses.
To do this in Excel:
- Select your full dataset
- Go to Insert → PivotTable
- Drag Code into the Rows field
- Drag Response ID into the Values field (set to Count)
This allows you to quickly see which issues are mentioned most often in customer feedback.
4. Interpret the results: Finally, review which themes appear most frequently to identify recurring friction points in the shopping experience, such as checkout usability or product fit, and use these insights to guide improvements in payment flow or sizing guides.
Now imagine working through 5,000 responses instead of 800. Going through each one individually would take a significant amount of time, and that’s one of the many challenges of qualitative survey analysis that we’ll expand on below.
Go beyond surface-level metrics with fast, high-quality analysis of your open-ended responses using Blix.
Challenges of Qualitative Survey Analysis
While qualitative survey analysis can provide valuable context behind customer experiences, it also comes with practical challenges, especially as the volume of open-ended feedback grows.
- Time requirements: Manual review of open-ended responses is extremely time-consuming. Based on our interviews with customers, analysts often spend several hours building a codebook before coding begins. Coding itself can take roughly an hour for every 100 responses (and that doesn’t include breaks), meaning large datasets can quickly require many hours, days, or weeks of work.
- Researcher bias: Coding feedback consistently across large datasets may introduce subjective interpretation.
- Skill level: The process may require a moderate to advanced skill level, particularly when applying coding frameworks, building a reliable codebook, and interpreting themes accurately.
- Language challenges: In global surveys, responses often appear in multiple languages. Researchers may need to translate responses before coding them, which adds time to the process and can make it more difficult to maintain consistent themes across the dataset.
This is where qualitative analysis software comes in, helping teams manage larger volumes of open-ended feedback, apply consistent coding, and identify recurring themes more efficiently.
Step by Step: Using AI for Qualitative Survey Analysis
AI-powered text analysis tools can analyze large sets of open-ended responses and group them into themes, identifying patterns that are hard to catch when you’re reading comments one by one.
A key difference with modern text analysis tools is that they group feedback by what customers mean, instead of looking only for exact keyword matches. Even if customers use different words or phrases, AI can recognize when responses describe the same problem.
For a clothing brand, that means comments like “runs small,” “tight in the shoulders,” and “size chart didn’t help” can roll up into a consistent fit/sizing theme.
Blix is built for this kind of meaning-first coding so market research teams can move from raw verbatims to decision-ready themes faster, then review, refine, and report with more confidence.
How Blix Helps Teams Analyze Open-Ended Feedback Faster
To illustrate how this works, we’ll continue using the clothing brand example mentioned earlier. Instead of manually reading every response, researchers can quickly see the main issues customers are raising and gain clear insight into patterns in customer feedback. Blix simplifies this process in just a few steps.
1. Upload your dataset: Export your open-ended survey responses in Excel, CSV, or SPSS format and upload it into Blix.
2. Create a codebook: Blix will automatically group similar responses into themes based on shared meaning. You can then review the suggested themes, rename, split, merge and refine them if needed, to match your research goals.
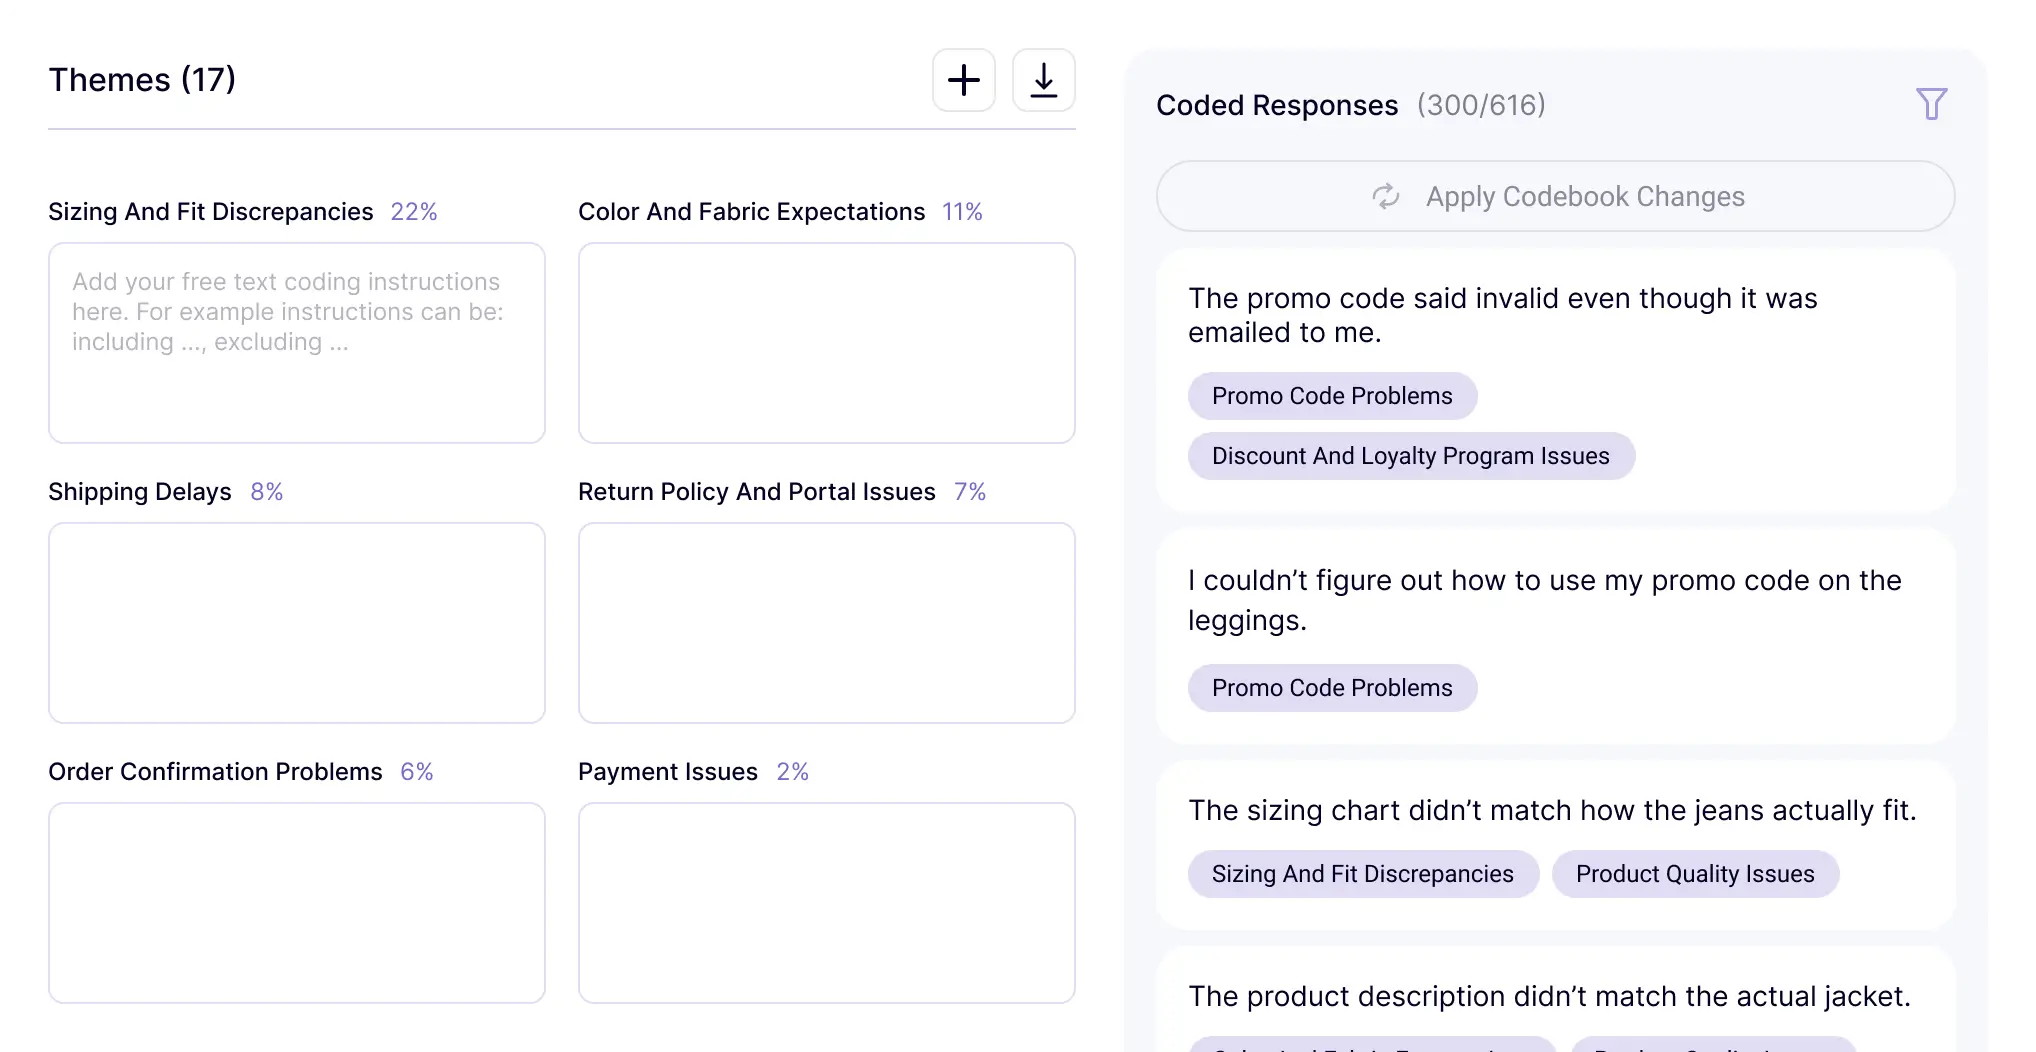
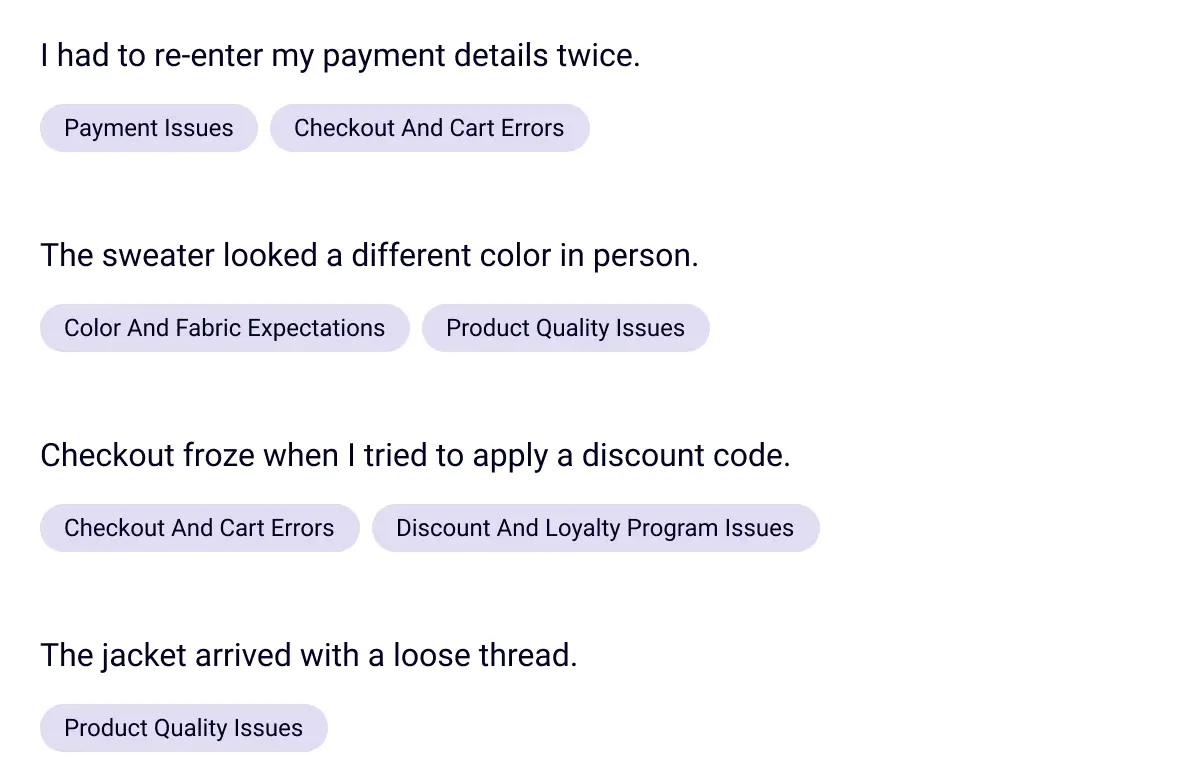
3. Code the responses: Blix will assign the relevant themes / codes to each open ended response in your survey automatically. Since customer comments often mention more than one issue, a single response can be assigned multiple themes.
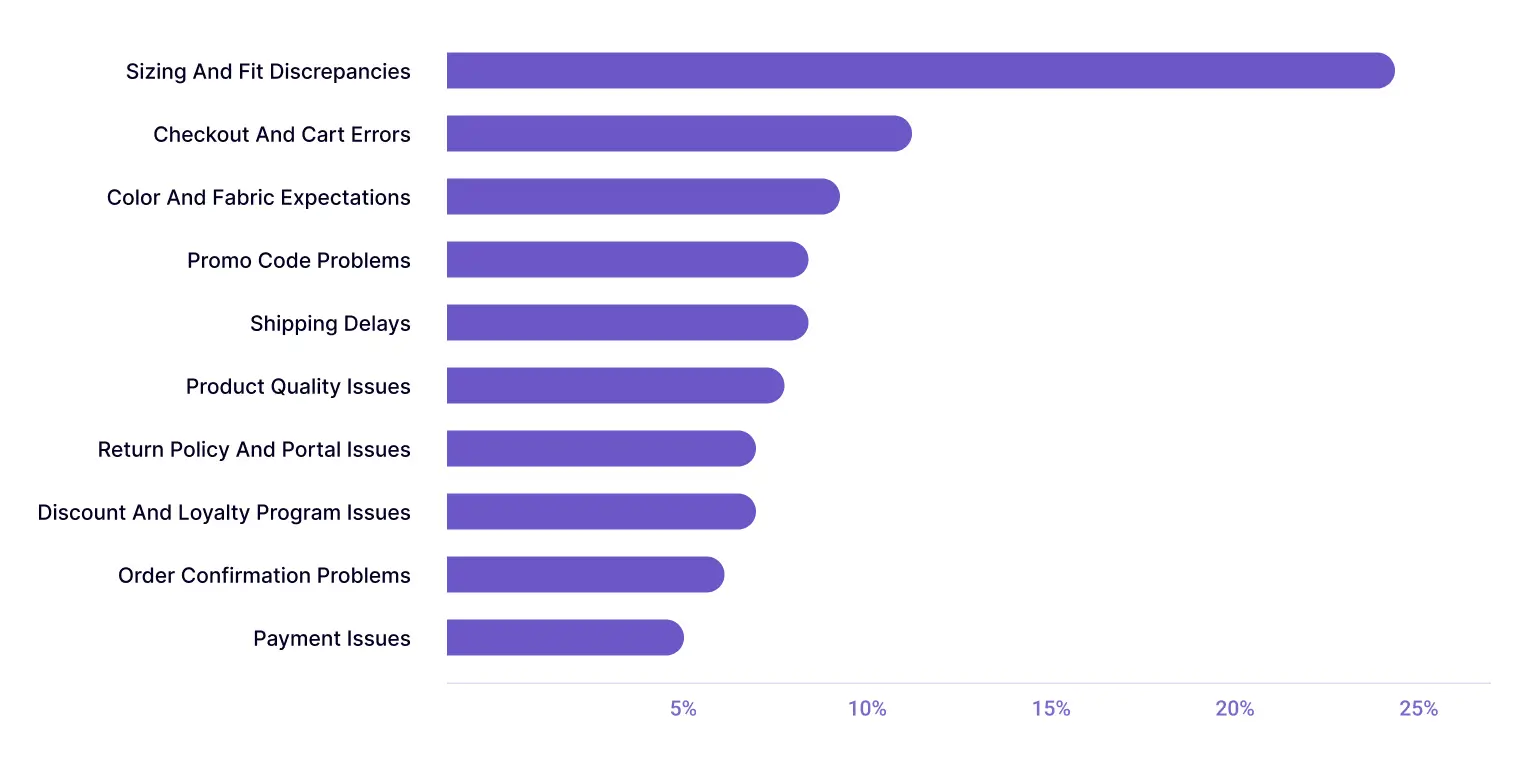
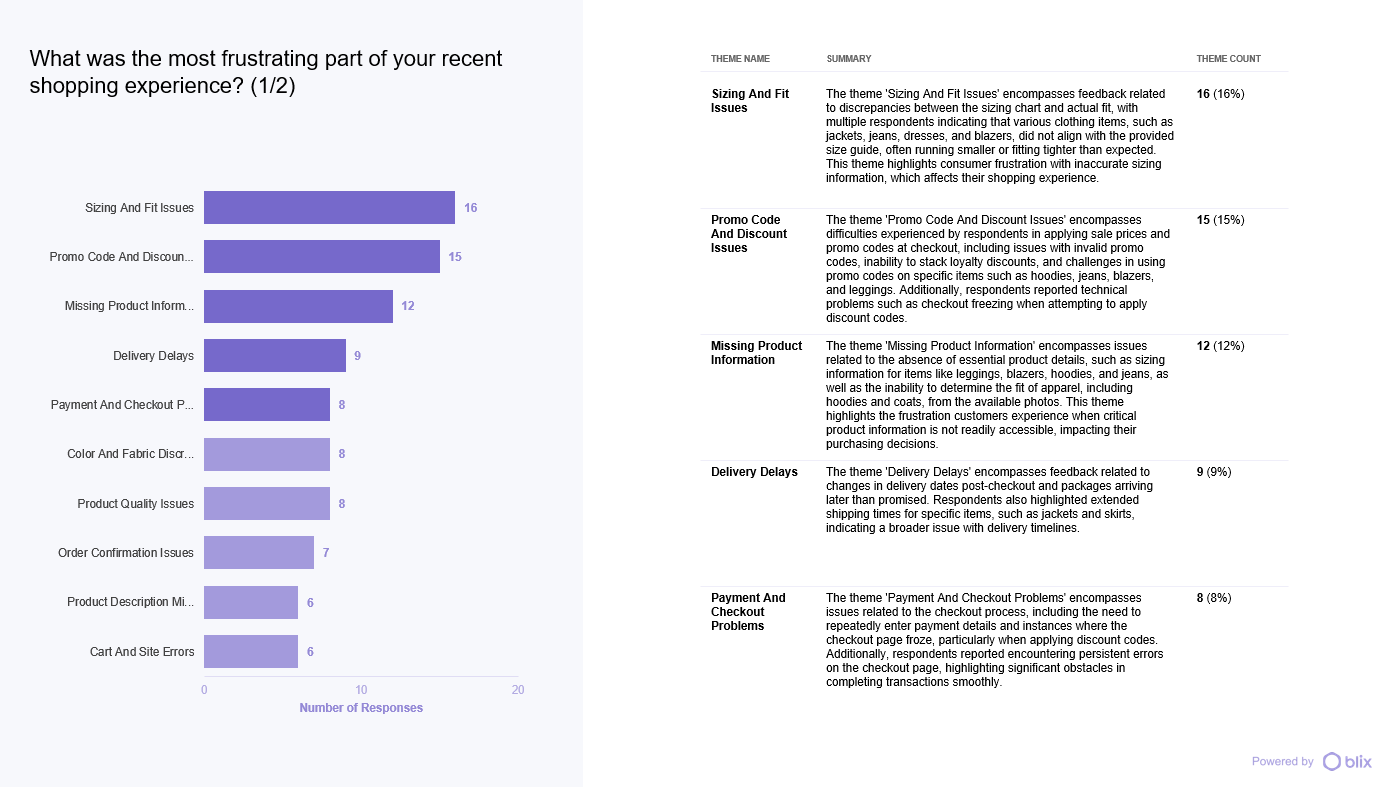
4. Analyze theme frequency: Blix will show how often each theme appears across responses, helping you identify recurring friction points such as checkout errors, shipping delays, or unclear payment issues.
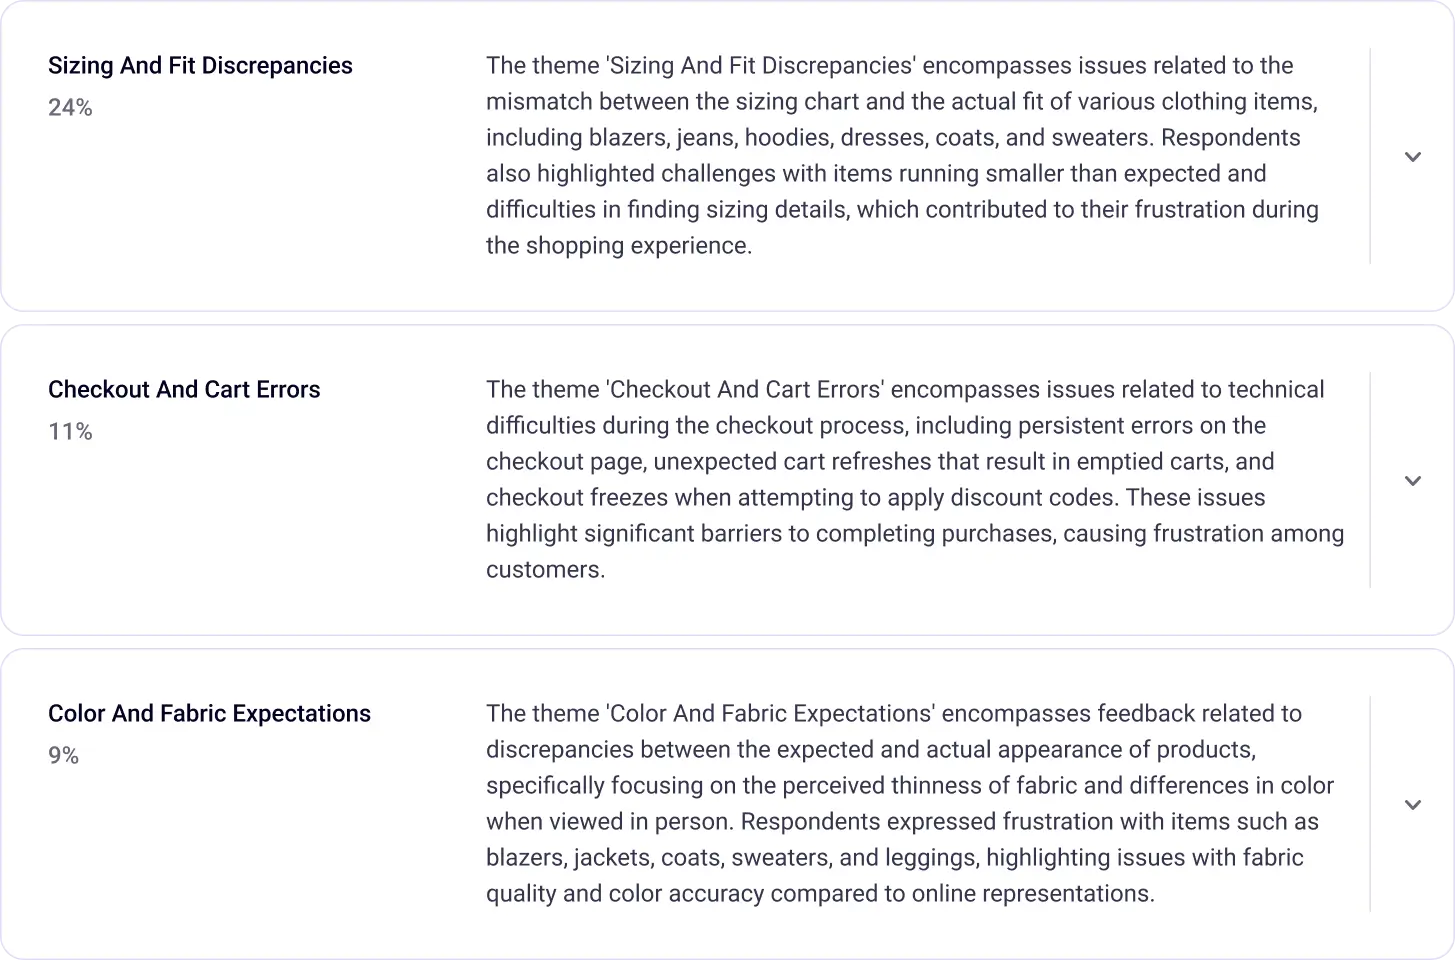
5. Summaries: Blix will also help you to dive deeper into the details with short summaries that encapsulate the main points that were raised under each topic.
6. Export: In minutes, you can identify recurring themes, extract representative quotes, view frequency breakdowns, and export the results to Excel or SPSS:
7. Presentations: Plus, you have the option to instantly create designed PowerPoint slides based on your data. You can easily create a slide for each cohort in your data.
With these insights, you now have quantified customer feedback that can support clearer, more confident decision-making about your products, services, brand direction, and more.
Turning Open-Ended Feedback Into Actionable Insights
Open-ended survey responses contain valuable signals about what customers are experiencing, but reviewing them manually can take hours.
Tools like Blix help teams quickly group similar responses into themes so they can see the issues customers are raising and support decisions with real feedback. Instead of sorting through hundreds of comments, teams can move from open-ended responses to clear themes in minutes with just a click of a button.
Ready to turn survey feedback into clear insights? See how Blix analyzes open-ended responses in minutes.


